Mohr's Circle: Reading Stress at Any Angle From a Single Diagram
July 2026
Original post: @mathemetica on X, 2026-07-22. If the embed above doesn’t load, the same image and description are below.
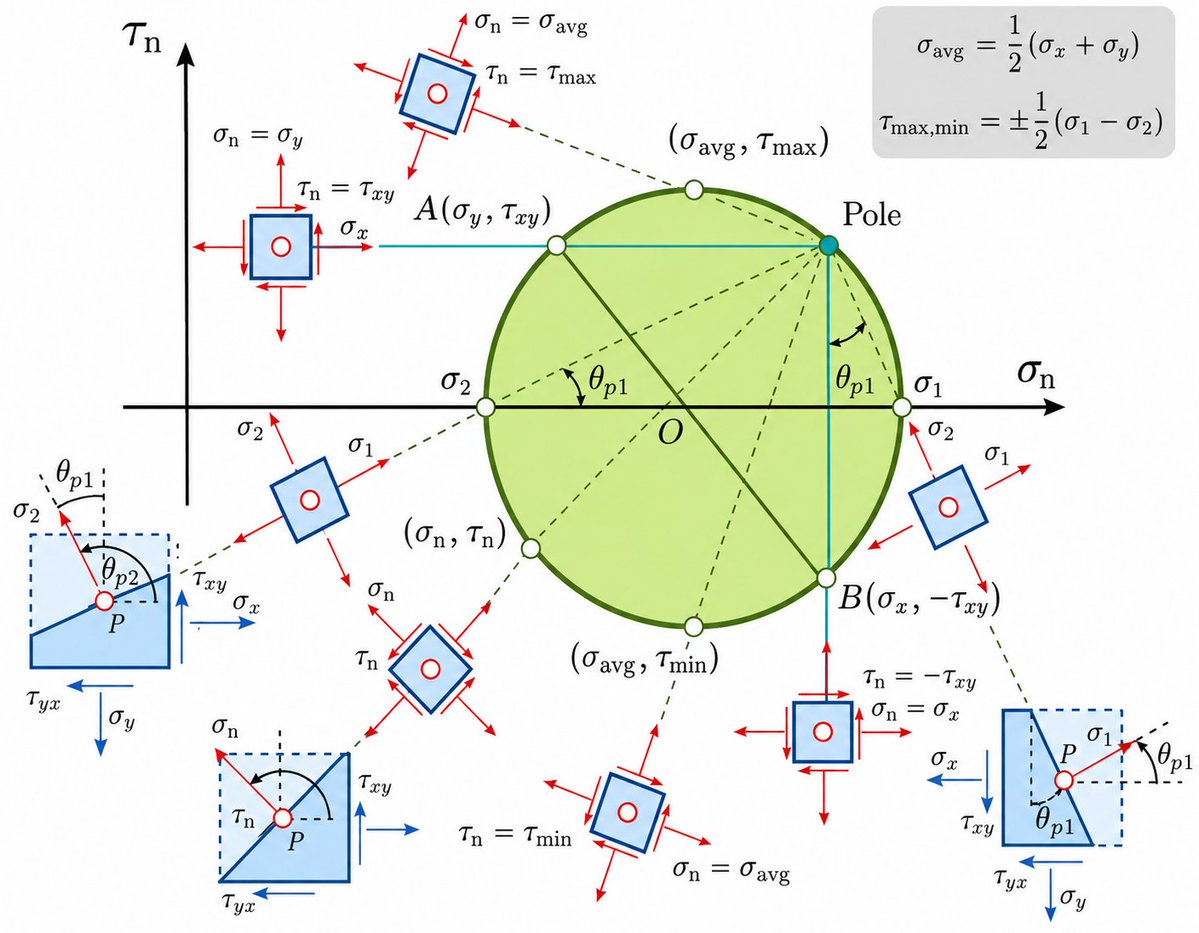
What this is showing
Mohr’s Circle is a graphical method for finding the normal stress ($\sigma_n$) and shear stress ($\tau_n$) acting on a material at any orientation, given the stresses on just two reference planes ($\sigma_x$, $\sigma_y$, $\tau_{xy}$). Instead of recomputing the stress-transformation equations by hand for every angle of interest, every possible orientation’s stress state lies somewhere on the circle — read the coordinates off the diagram directly. The small rotated squares around the circle show the physical stress element at each of those orientations, making the abstract transformation tangible: as the cutting angle changes, the normal and shear stress trade off against each other, sweeping around the circle.
The circle is centered at the average normal stress $\sigma_{avg} = \tfrac{1}{2}(\sigma_x+\sigma_y)$, with radius equal to the maximum shear stress $\tau_{max} = \tfrac{1}{2}(\sigma_1-\sigma_2)$. Its two extreme points on the horizontal axis ($\sigma_1$, $\sigma_2$) are the principal stresses — the orientation at which shear vanishes entirely and normal stress is purely tension or compression — while the top and bottom of the circle mark the orientation of maximum shear.
The real physics behind it
This is standard mechanical/structural engineering, developed by Christian Otto Mohr in 1882 and used essentially unchanged ever since. It’s a direct graphical consequence of the 2D stress transformation equations (themselves derived from equilibrium of a rotated stress element — nothing more exotic than force balance), and it remains a core part of any mechanical, civil, or aerospace engineering curriculum because it makes finding principal stresses and maximum shear — the values that actually determine whether a material yields or fractures — a matter of reading a diagram rather than grinding through trigonometric transformation formulas by hand.
Catalog status: Proven Systems
This is a graphical restatement of exact stress-transformation equations derived from equilibrium — not an approximation or a model under test, just a different (and faster) way to see an exact result.
Where this touches PBT
Nothing here connects to Pressure-Based Theory specifically — this is classical continuum mechanics, describing stress within a solid material, independent of PBT’s own claims about the origin of gravity or fundamental forces. Included here because it’s a genuinely elegant piece of engineering visualization worth having a durable home for.