T-Branch vs. Y-Branch Ductwork: Why the Angle of a Junction Changes Everything
July 2026
Original post: @waitwuut on X, 2026-07-22. The post’s own caption is a short, partly non-English phrase (“cube-shaped ceilings airflow…”, truncated) that doesn’t fully translate cleanly — the visual itself is what matters here, described in full below. If the embed above doesn’t load (it’s a video), the same content is captured in the still frame below and described in full below that.
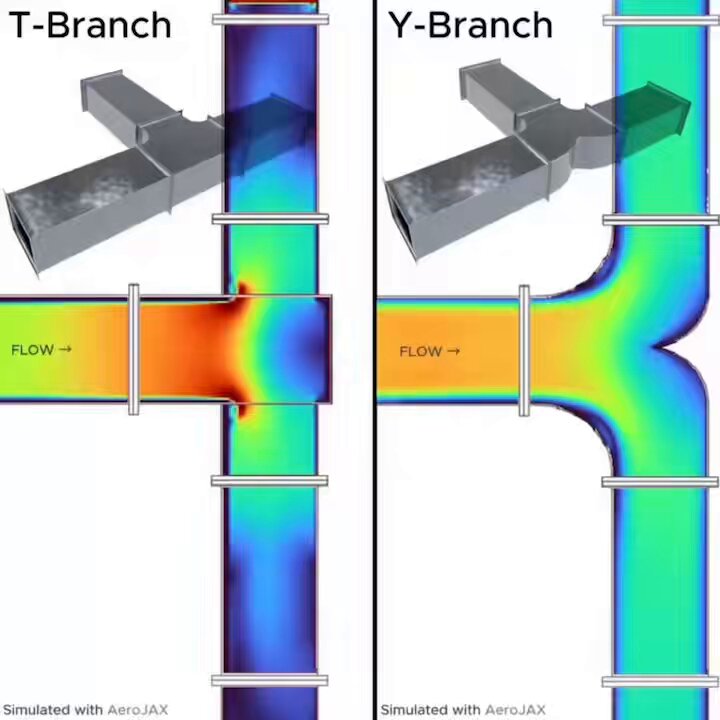
What this is showing
This is a computational fluid dynamics (CFD) simulation (the video itself credits the simulation tool “AeroJAX”) comparing two ways of joining a side branch into a main duct run:
- T-Branch (left): the side duct meets the main duct at a sharp 90° angle.
- Y-Branch (right): the side duct meets the main duct at a shallow, swept angle.
Both are fed the same flow, moving the same direction (“FLOW →”), through the same size main duct. The color map is a standard CFD velocity/pressure field: blue and green represent smooth, undisturbed flow; orange and red represent regions of high turbulence and pressure buildup.
In the T-branch, the incoming side-flow slams into the main flow at a right angle, and the video shows a large orange/red zone right at the junction — turbulent mixing and a real pressure spike, exactly where the two flows collide head-on. In the Y-branch, the same side-flow merges in at a shallow angle, and the color stays green/blue almost all the way through — the flow blends in with far less turbulence and far less pressure loss.
The real physics behind it
This isn’t a subtle or PBT-specific effect — it’s a well-established, textbook result in fluid dynamics and HVAC/piping engineering, governed by the same Navier-Stokes equations that describe all real fluid flow. Any duct or pipe fitting imposes a pressure loss coefficient (sometimes called a K-factor or loss coefficient, $\zeta$) that depends on the fitting’s geometry — sharper turns and abrupt junctions cost more pressure (and, in a moving-air or moving-fluid system, more fan/pump energy) than gradual ones. A 90° tee (T-branch) has a substantially higher loss coefficient than a swept, angled wye (Y-branch) carrying the same flow split, precisely because the abrupt junction forces the flow to violently change direction, generating separation and turbulence. This is exactly why real HVAC and plumbing design guides (e.g. ASHRAE’s duct fitting database) favor angled branch takeoffs over square tees wherever duct routing allows it, and why real pipefitting favor wyes over tees when a smooth merge matters (drainage lines being the classic example).
Catalog status: Proven Systems
Pressure loss at duct/pipe junctions from turbulent separation is standard, extremely well-confirmed fluid mechanics — measured, tabulated, and used in real engineering design every day. The CFD simulation shown here is a model built on those same governing equations (Navier-Stokes), not a novel claim; it’s a clear visual of a real, already-proven effect.
Where this touches PBT
Nothing here is a claim about Pressure-Based Theory specifically — this is ordinary fluid dynamics in air ducts, unrelated to PBT’s own aether-medium claims about gravity and force unification. It’s included here simply because it’s a genuinely clear, well-made visualization of a real pressure/flow phenomenon, in the same spirit as the rest of this section.