Visuals
A place to house striking visual demonstrations of real physics and engineering — CFD simulations, flow visualizations, diagrams, photos, and video that make an effect visible in a way words alone don’t. Each entry carries the original source (embedded where possible, saved as a static image as a fallback) alongside a plain-language explanation of what it’s actually showing. As with Field Notes, not every entry connects to Pressure-Based Theory directly — some are just real physics worth seeing clearly. Where a genuine connection to PBT exists, it’s called out explicitly rather than implied. See the Catalog for how the underlying physics in each entry is classified.
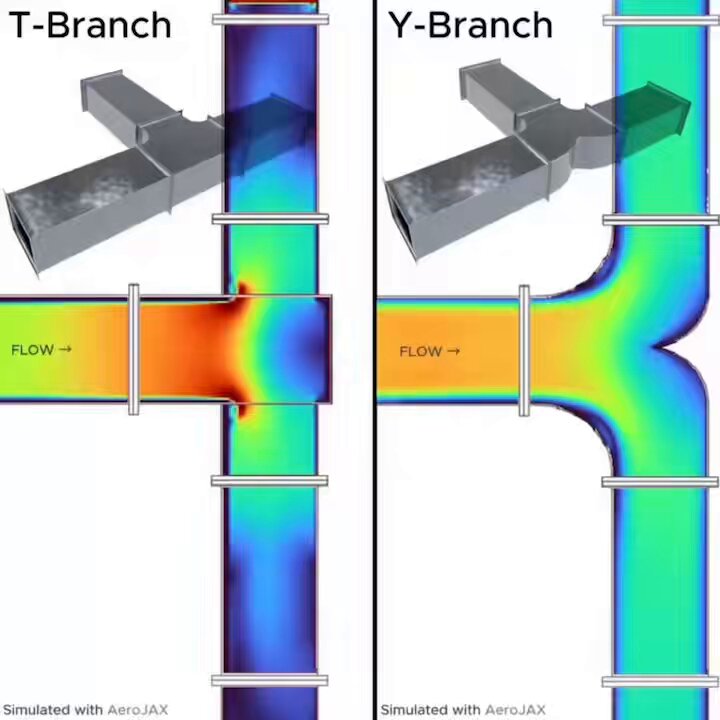 T-Branch vs. Y-Branch Ductwork: Why the Angle of a Junction Changes Everything
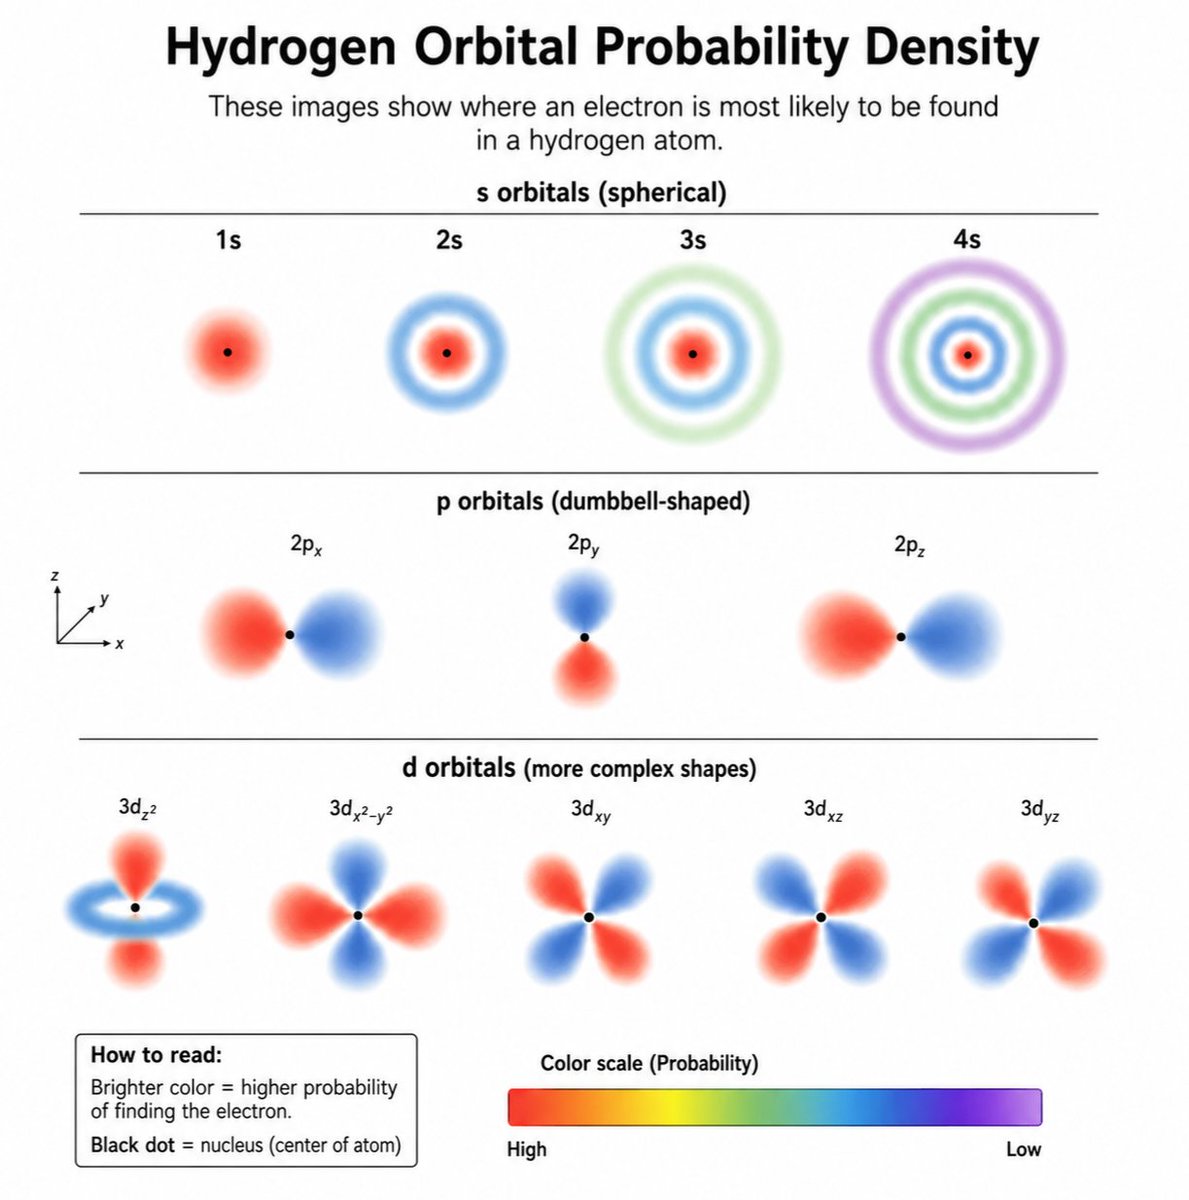 Hydrogen Orbital Probability Density
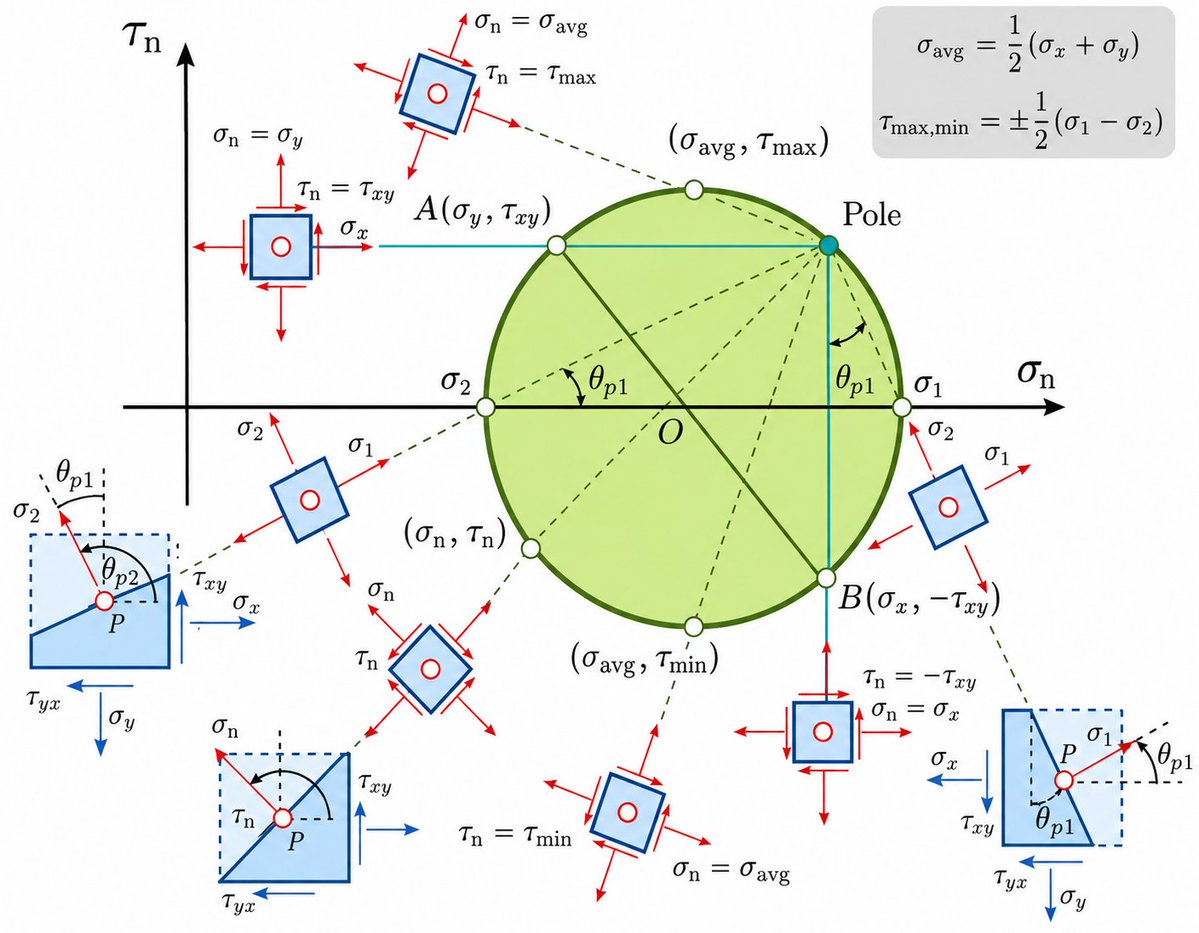 Mohr's Circle: Reading Stress at Any Angle From a Single Diagram
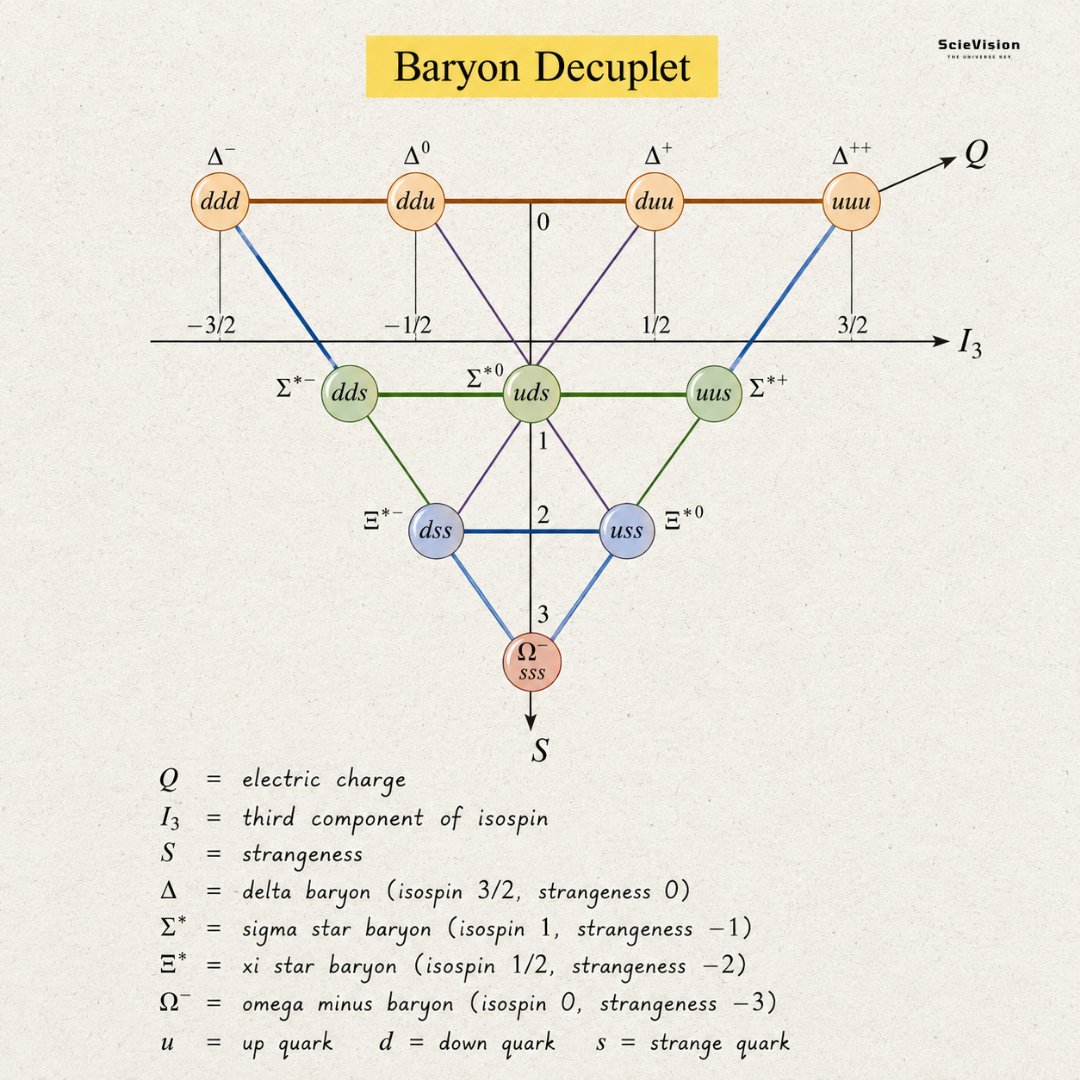 The Baryon Decuplet: The Diagram That Predicted a Particle
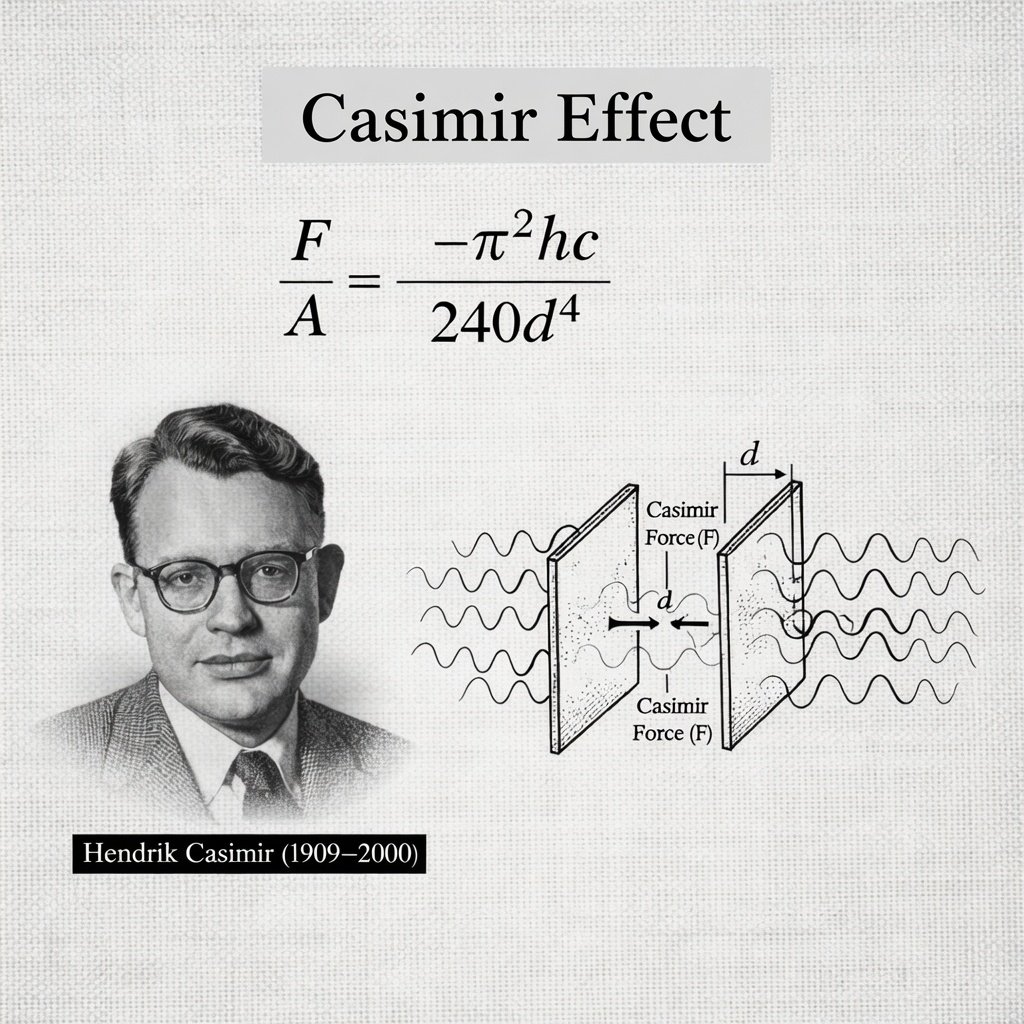 The Casimir Effect
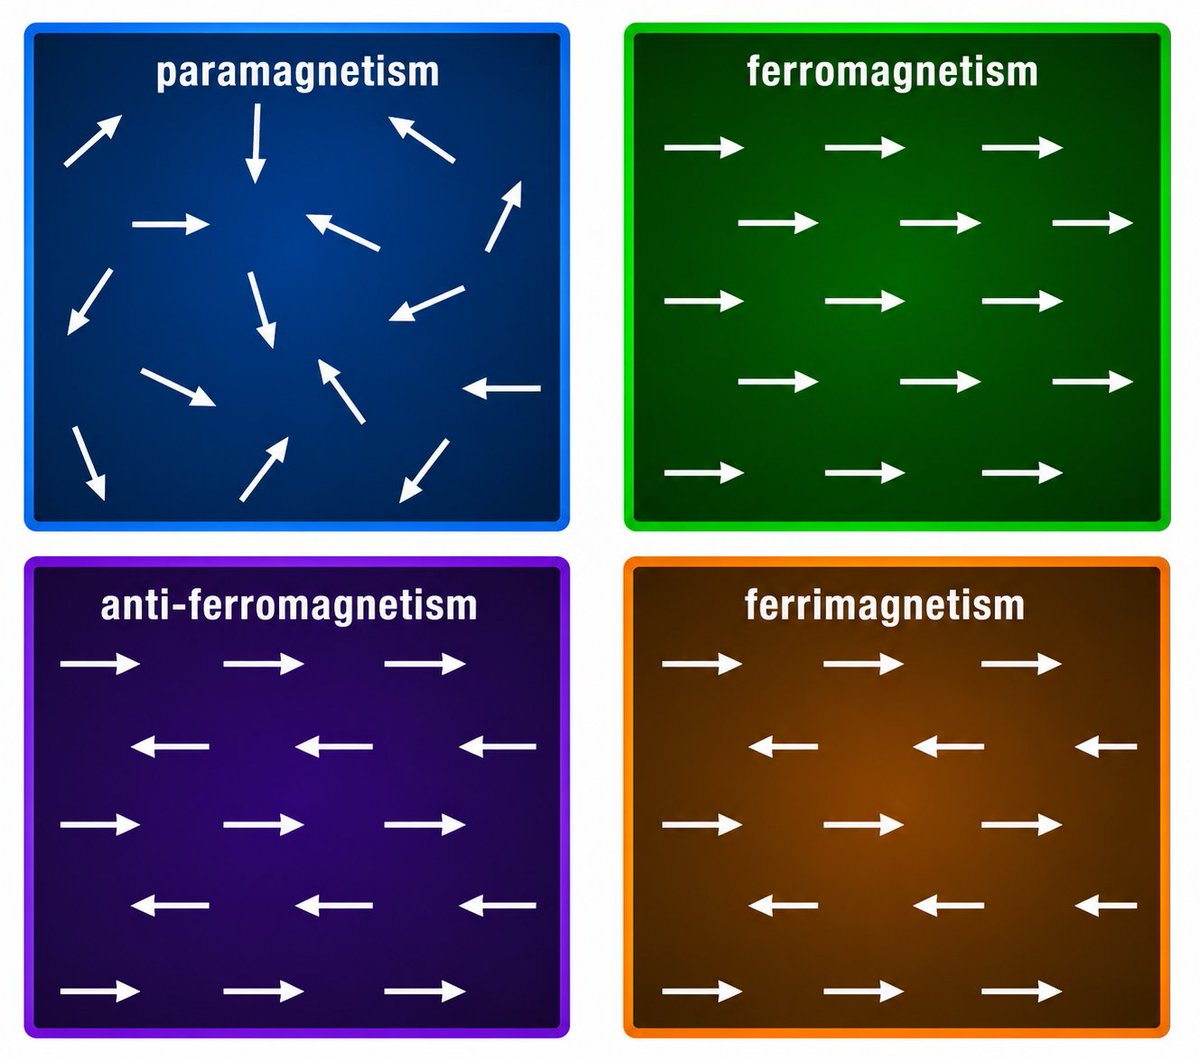 Four Ways Atomic Spins Can Order Themselves
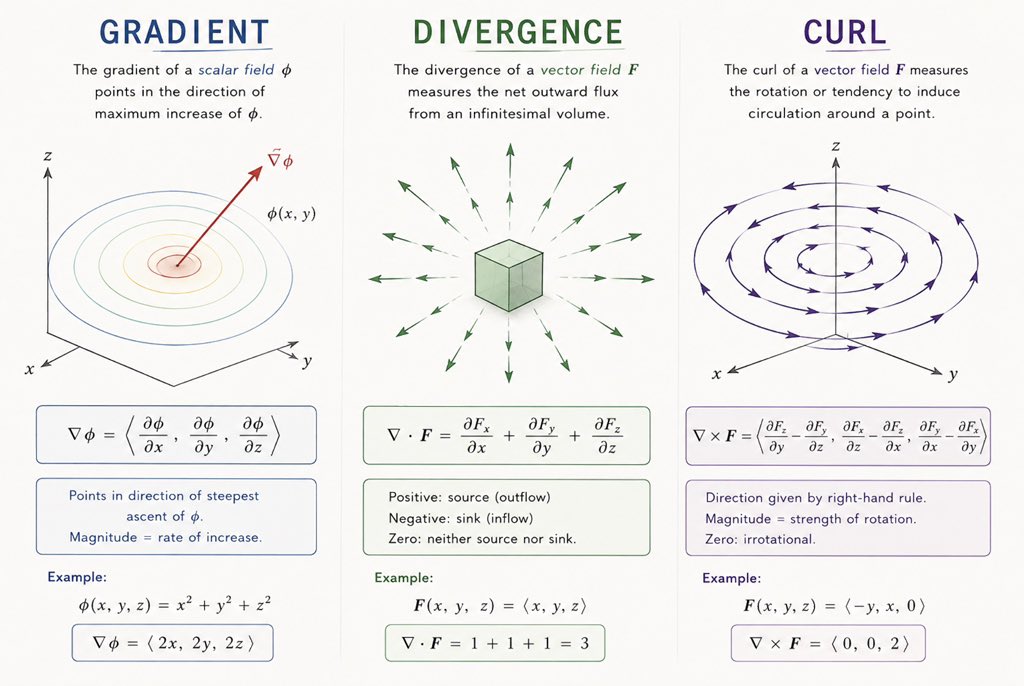 Gradient, Divergence, and Curl: The Three Questions Vector Calculus Asks
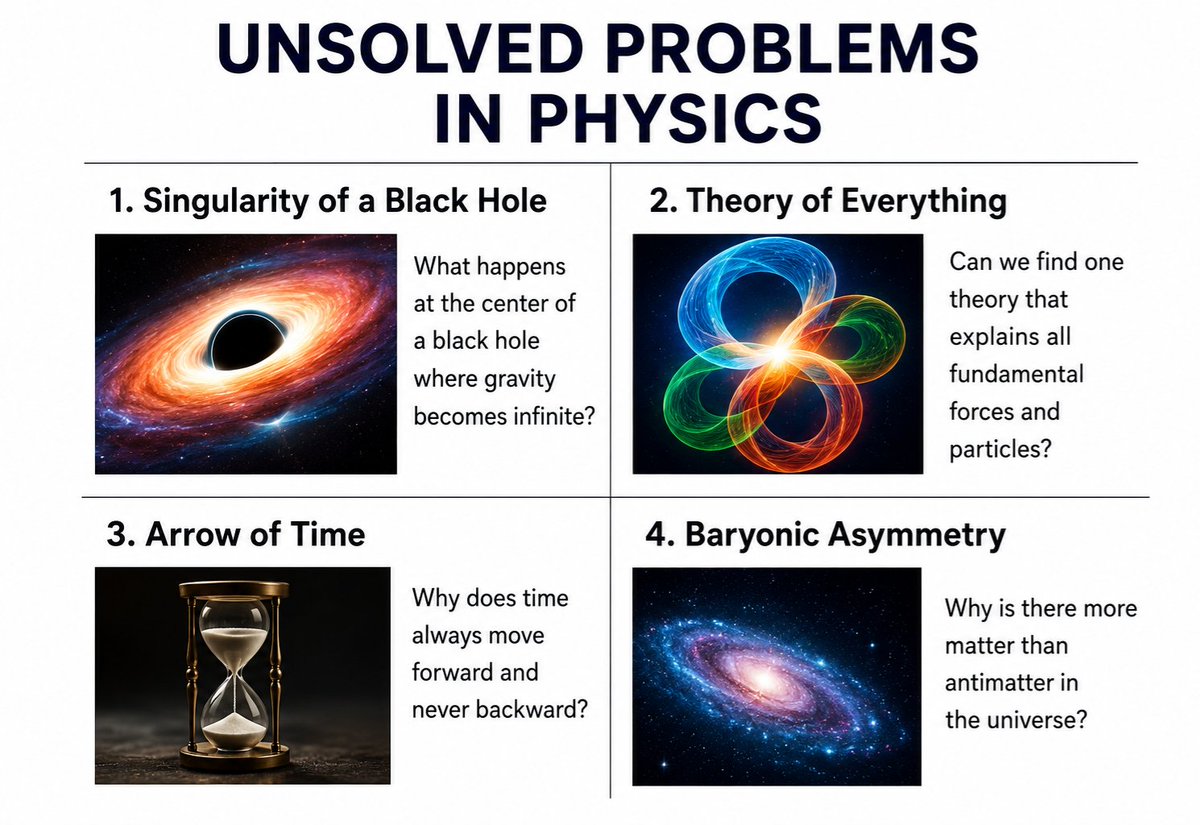 Four Real Open Problems in Physics, In One Frame
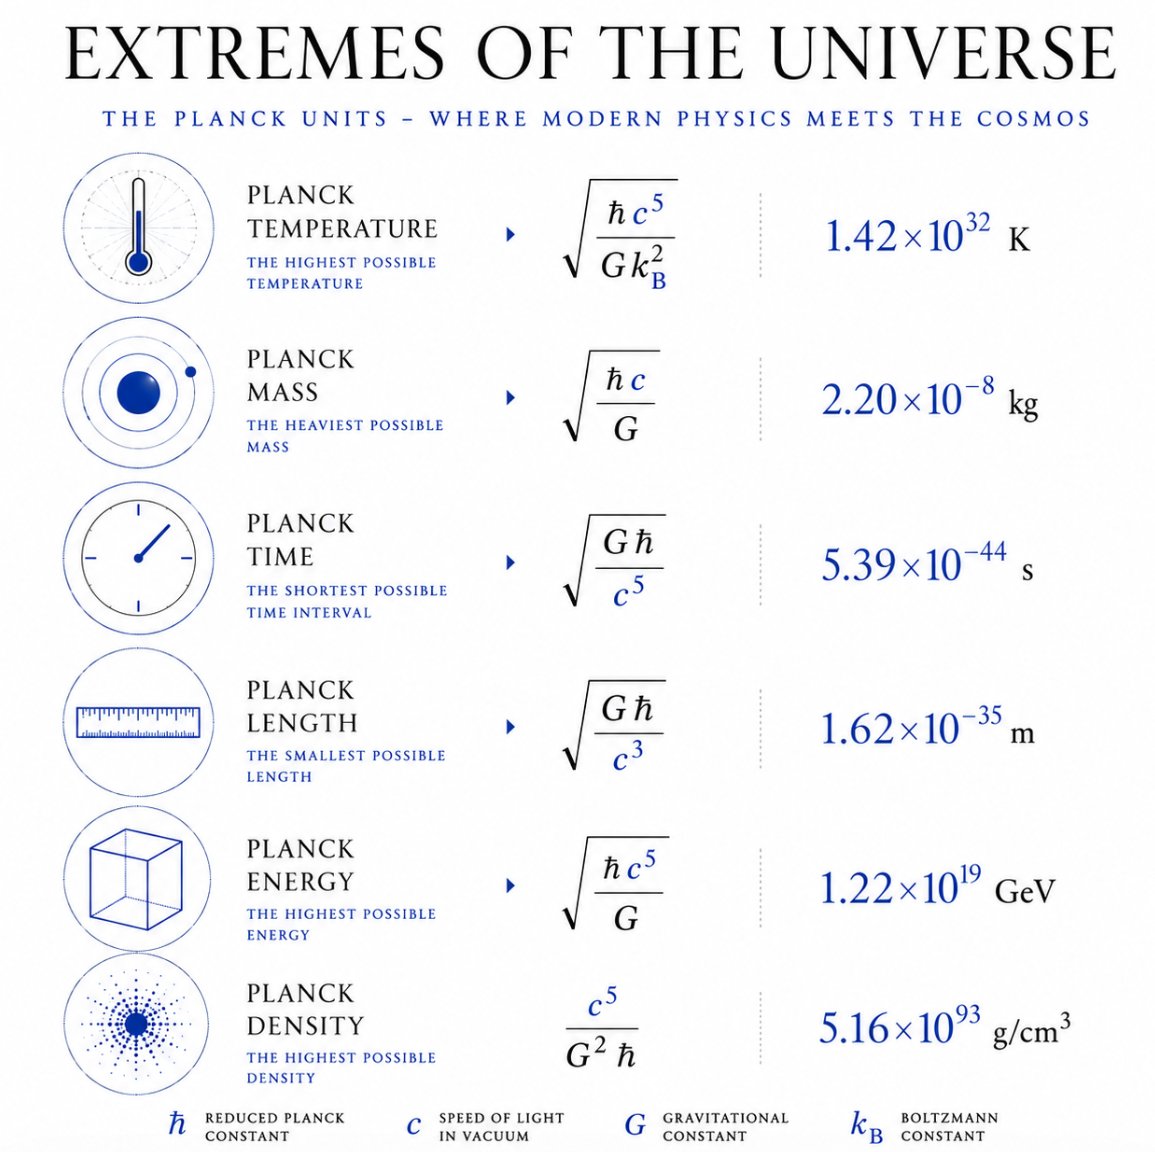 The Planck Units: What They Actually Mark, and What They Don't
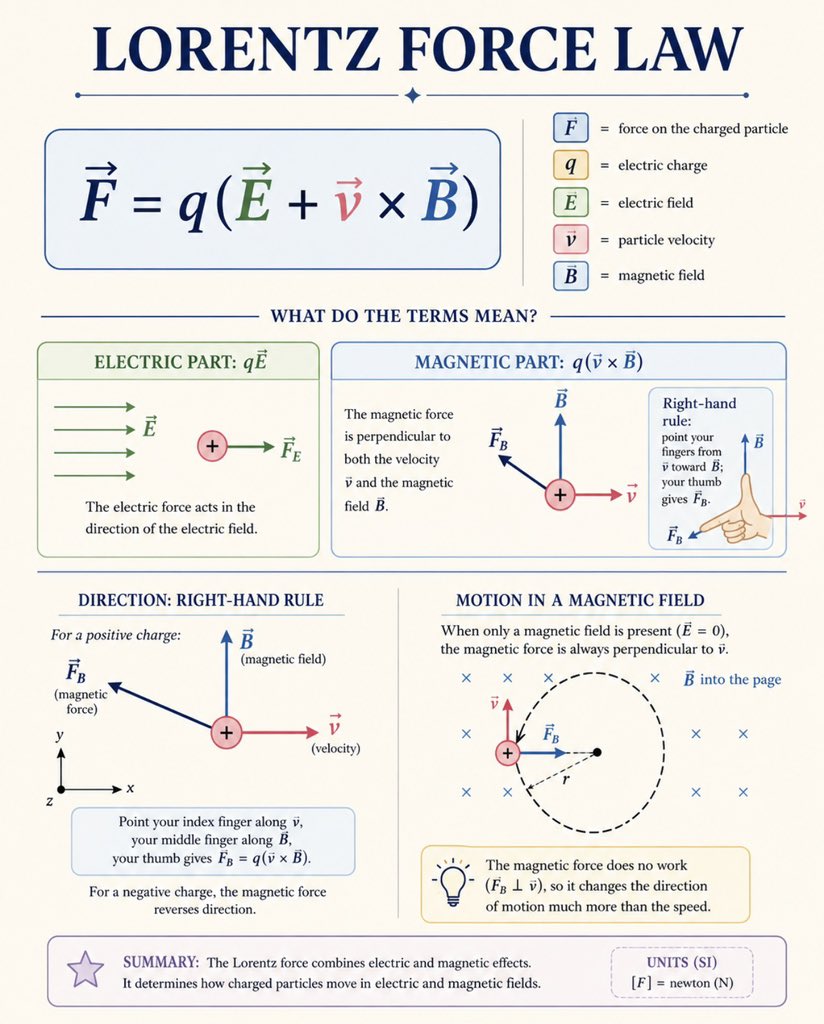 The Lorentz Force: Why the Force Arrow Comes Out of the Page
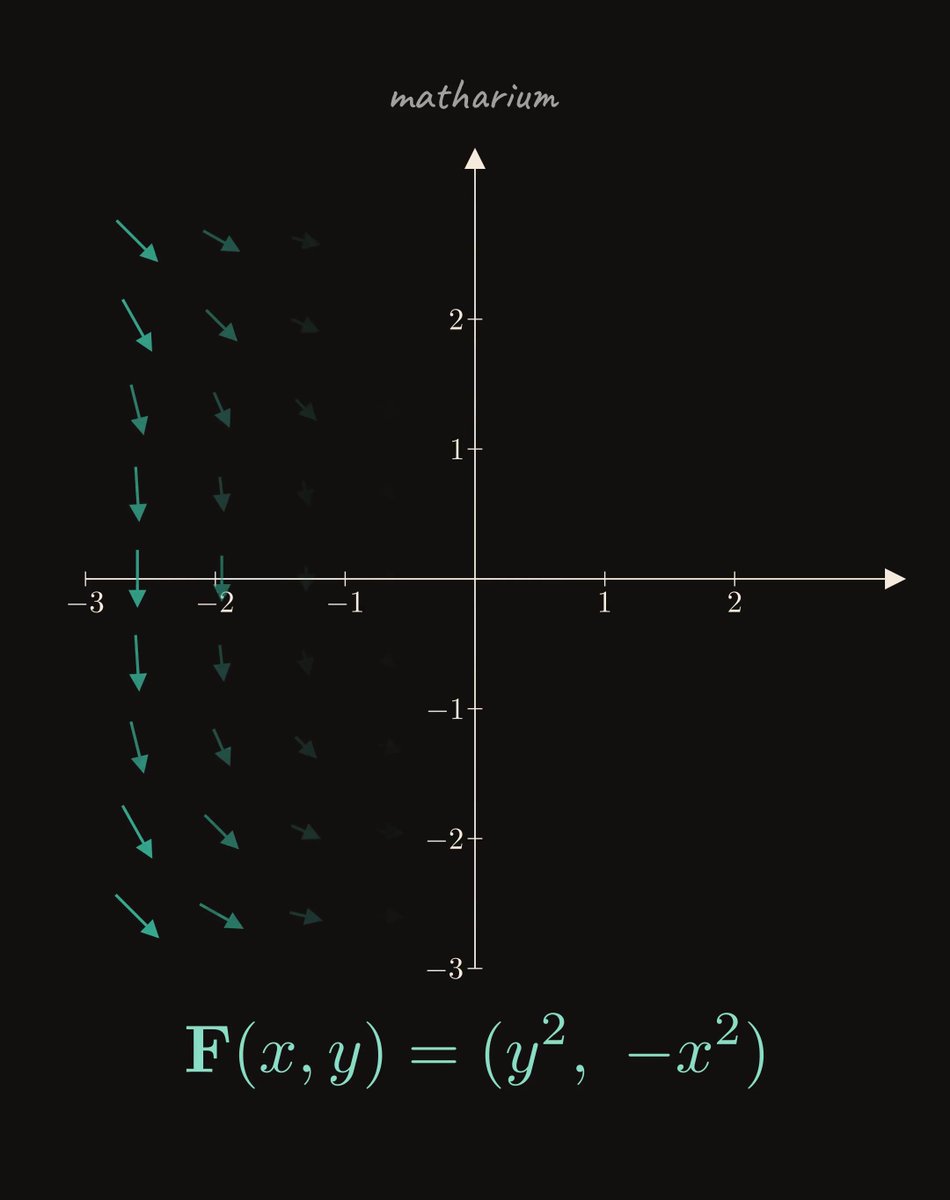 Hamiltonian Flows: Why Some Streamlines Preserve Area and Others Don't
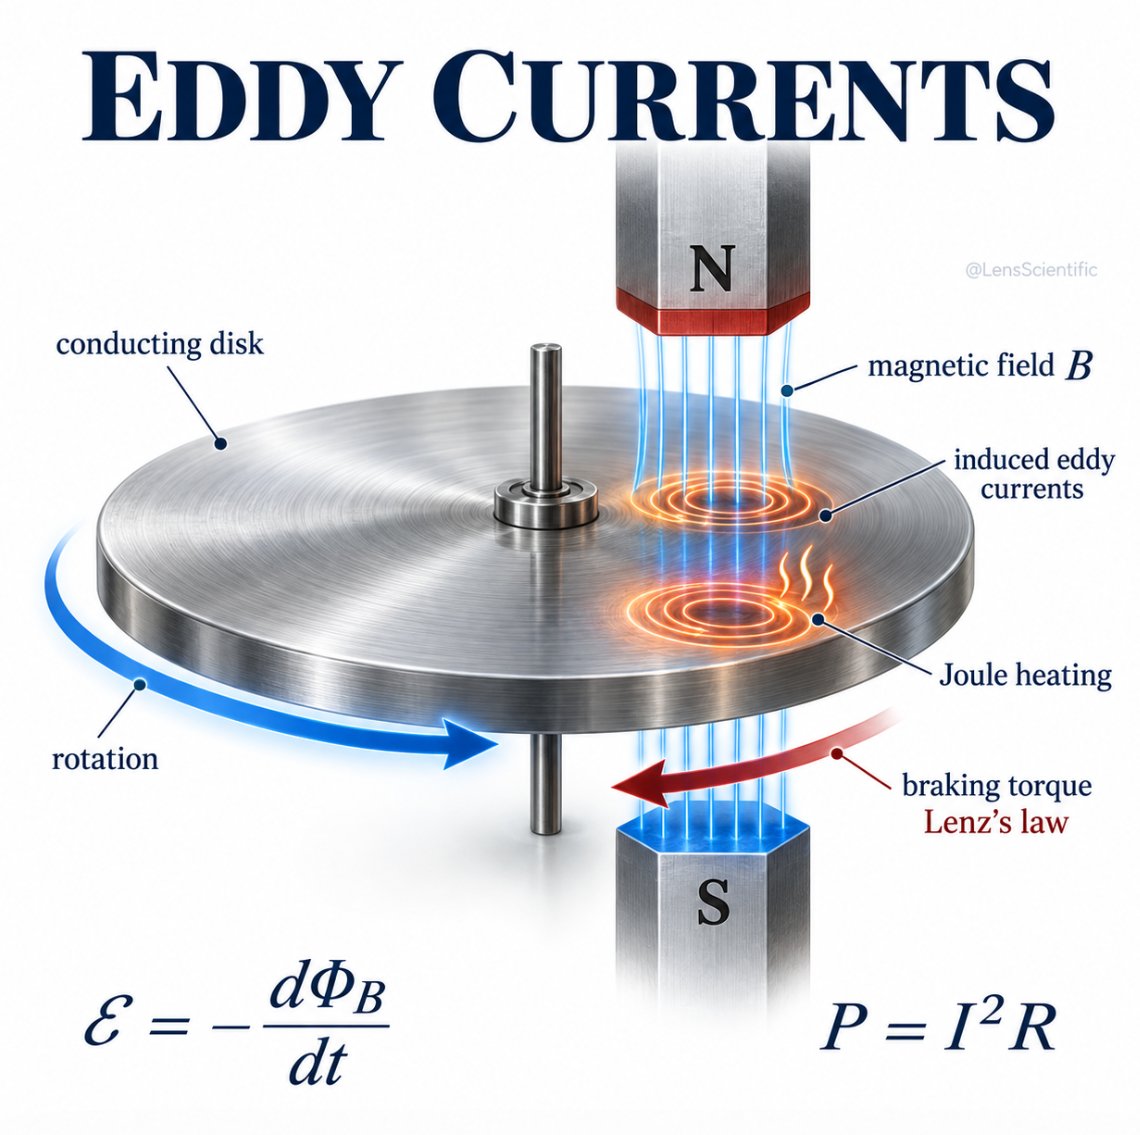 Eddy Currents: Braking Without Touching Anything