Sound In, Light Out: What a Glowing Bubble Is Actually Doing
19 September 2026
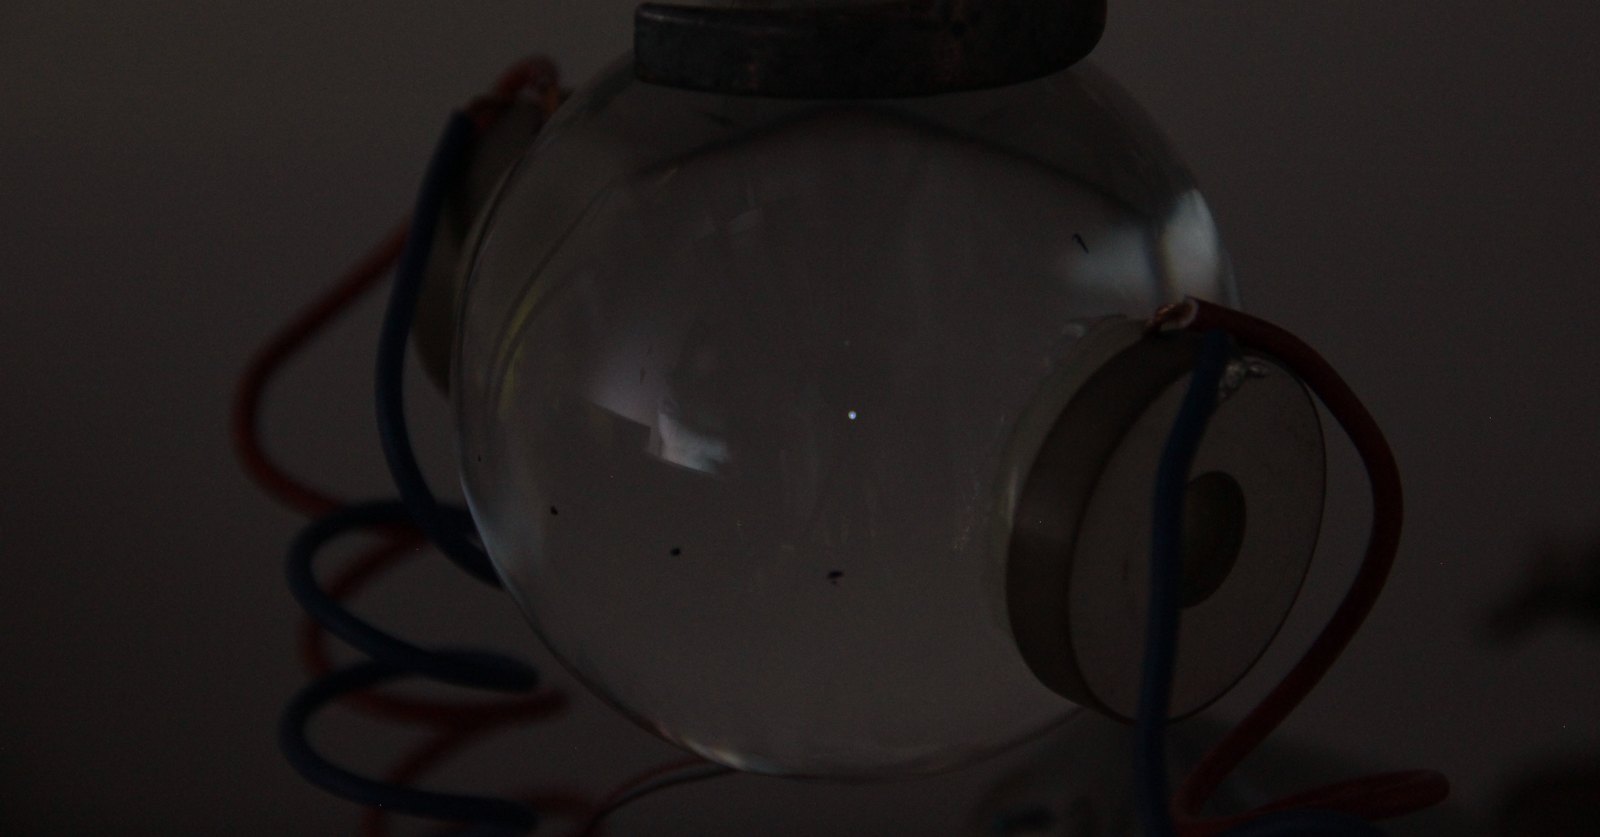 A single bubble glowing at the centre of a flask of degassed water, driven at about 25.7 kHz, four-second exposure. Photo: JWvE, via Wikimedia Commons, CC BY-SA 4.0; cropped to the flask and shared under the same licence.
This week I reposted an eight-second clip from @RobLogic with a caption that read “When a sound wave turns into light: the unsolved mystery of sonoluminescence,”
Simple question: What is happening here?
Turns out no one knows for sure what that flash is made of.
We have several things to compare from practical knowledge. Some of those turned up in the replies … One word: cavitation. One line: energy goes in, photons come out. One memory: boat propellers can do it too, the gas glows like a neon sign, and the water stays cold.
The mechanism appears to involve transformation of pressure the whole way through. A sound wave is a pressure wave. The bubble is a piston that pressure drives.
What we believe we know …
The route from sound to a tiny, luminous core has been measured from the outside, link by link, for thirty years, and spectroscopy puts that core at thousands of kelvin.
The primary working theory …
The favoured account of the light is that the core gets hot enough to strip electrons off some of its atoms and the resulting plasma glows. What that core is at the instant it glows, and how it radiates, is inferred from the light itself and is still argued between named research groups.
What the video shows
The rig is a round flask of water with two piezoelectric discs glued to its sides. The discs drive a standing sound wave at a frequency a little above hearing, 25 to 27 kHz in the two photographs on this page. The water has been partly degassed, because a bubble in fully aerated water grows by taking up dissolved gas and will not stay put.
One bubble sits at the centre. It is held there by the sound field itself: at these drive levels an oscillating bubble in a standing wave feels a time-averaged push toward the pressure antinode, the primary Bjerknes force, which is what parks it against buoyancy for hours. Once per cycle the bubble grows while the local pressure is low and collapses while it is high. At the bottom of the collapse it emits a flash. At 25,000 flashes a second the eye sees a steady point of light.
How it was found
According to the standard accounts, Marinesco and Trillat reported in 1933 that photographic plates fogged in water carrying ultrasound, and in 1934 Hermann Frenzel and H. Schultes at the University of Cologne showed the fogging was light from the water itself. Many bubbles were forming, collapsing, and flashing at once. That is now called multi-bubble sonoluminescence, and for more than half a century it was, for practical purposes, the only kind studied.
In 1990 Felipe Gaitan, a graduate student working with Lawrence Crum at the National Center for Physical Acoustics in Mississippi, got one bubble to sit still and flash once per cycle. The 1992 paper in the Journal of the Acoustical Society of America reports glycerine and water mixtures, drive amplitudes around 150 kPa at 21 to 25 kHz, and light from the geometric centre of the bubble, simultaneous with the collapse. A single stable bubble is something you can point instruments at, and the field opened up.
In 1991 Bradley Barber and Seth Putterman reported that each flash held over a hundred thousand photons, was too short for the fastest photomultiplier to resolve, repeated with clock-like regularity for hours, and represented, in their words, “an amplification of energy by eleven orders of magnitude.” In 1997 Weninger, Barber and Putterman timed the collapse itself with pulsed laser scattering and found the wall moving at more than four times the ambient speed of sound of the gas inside, with the flash arriving within half a nanosecond of the minimum radius. The same year Gompf and colleagues resolved the flash width with time-correlated single photon counting: about 60 picoseconds at low gas concentration and low drive, rising past 250 picoseconds near the upper limit, nearly Gaussian, and the same width in the red as in the ultraviolet. That last detail turned out to matter.
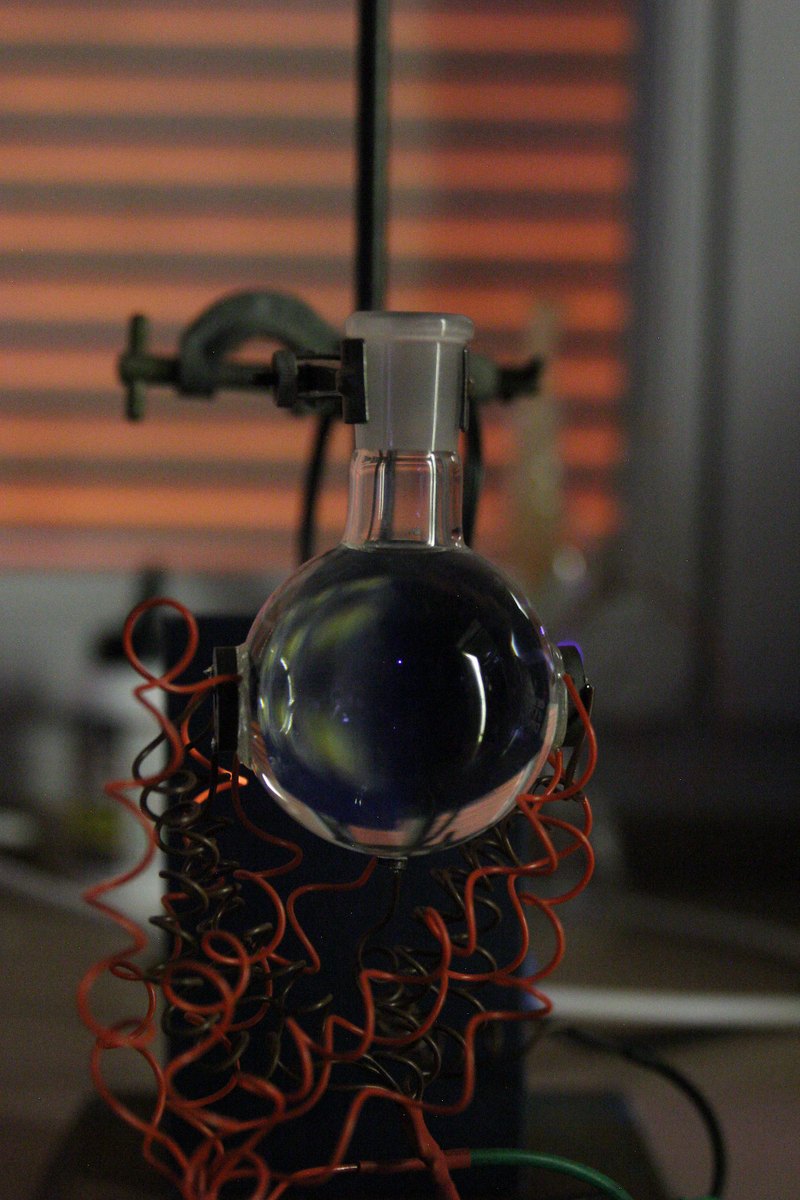 An air bubble trapped in degassed water by standing acoustic waves at 27,100 Hz, glowing at its centre. Photo: Beazzie, via Wikimedia Commons, CC BY-SA 4.0; resized only.
The chain, one link at a time
Sound is pressure. In water at 25 kHz with an acoustic pressure amplitude of about 1.3 atmospheres, the pressure at the antinode swings from 2.3 atmospheres down through zero into tension, every forty microseconds. This site’s Sound page carries the standard formulas.
The bubble breathes. During the tension half-cycle the bubble grows from a rest radius of a few micrometres to roughly ten times that. During the compression half-cycle the surrounding water rushes back in. Lord Rayleigh worked out the collapse of an empty spherical cavity in 1917, and his formula for the time from full size to nothing is 0.915 times the radius times the square root of the water’s density over the driving pressure. For a 50 micrometre bubble under one atmosphere that is 4.5 microseconds. In Rayleigh’s idealisation the wall accelerates without limit; by his formula it reaches the speed of sound in room-temperature argon, about 320 metres a second, when the bubble is a twelfth of its maximum size. The measurement above puts the real collapse past Mach 4 relative to the gas. In the real bubble the gas inside is what finally stops it.
Compression heats, but only at the end. For most of the cycle the gas stays at the water’s temperature. The expansion and the early collapse are slow compared with the time heat takes to cross a few micrometres of argon, so the gas is close to isothermal until the bubble is back near its rest size. Only the last stage, with the wall moving at hundreds of metres a second, is fast enough to trap the heat, and that stage compresses the gas the way a bicycle pump does. A calculation that treats the whole collapse from 50 micrometres as adiabatic gives a million kelvin, and is wrong for exactly this reason. The textbook estimate takes the last stage as adiabatic from about the rest radius: for pure argon, 293 kelvin times the square of the ratio of rest radius to minimum radius. That is an idealisation with two conventions in it, where the adiabatic stage begins and where it ends, and both matter. The bubble’s radius has been measured through most of the collapse, but the last few hundred picoseconds are below what laser scattering resolves, so the minimum radius is an estimate. Two published model estimates put it near a sixth of the rest radius: Storey and Szeri’s 2000 simulation of a 4.5 micrometre argon bubble reaches minimum at 0.14 to 0.18 of the rest radius across its cases, and a Rayleigh-Plesset fit to Bataller’s 2014 laser-scattering measurement of a xenon bubble in water gives a rest radius of 3.20 micrometres and a collapse radius of 0.547, a ratio of 0.17. The independent check is the light itself: the same bubble’s flash fits a blackbody with an emitting radius of 0.47 micrometres, about the fitted collapse radius. For a 5 micrometre argon bubble a sixth is 0.85 micrometres, and the estimate gives 10,000 kelvin. The script at the end also computes a floor: the radius the same gas would have if its atoms were packed to their van der Waals excluded volume, 0.55 micrometres, a soft bound since that constant is four times the atoms’ own volume. Two things this estimate leaves out pull in opposite directions. In Storey and Szeri’s simulation the centre of the bubble is already about 750 kelvin when the wall passes back through the rest radius, fifteen nanoseconds before minimum, so starting cold undercounts. Real bubbles also trap water vapour at collapse, and the vapour dissociates in reactions that absorb energy, so leaving it out overcounts: they computed that a vapour-free argon collapse would reach about 21,000 kelvin and that trapped vapour and its chemistry bring the peak down to 7,000 to 10,000 kelvin. The estimate lands in the measured range; it is not a derivation of it.
The measurements, and where they were made. In water, a sonoluminescing bubble driven hard gives a featureless continuum spectrum, and temperatures come from fitting it as a blackbody: Vazquez, Camara, Putterman and Weninger reported in 2001 a range from 6,000 kelvin for hydrogen to 20,000 kelvin for helium across hydrogen and noble-gas bubbles, with the heavier gases at the low end. At low drive the spectrum does show molecular bands, as Young, Nelson and Kang found the same year. Flannigan and Suslick moved to concentrated sulphuric acid, which has a very low vapour pressure, to get a brighter bubble with atomic lines in its spectrum, and lines give a temperature without assuming how the continuum is made. Their 2005 Nature paper reports emission from argon atoms, sulphur monoxide, and oxygen molecular ions, with spectroscopic temperatures from 4,000 to 15,000 kelvin. Their 2010 Nature Physics paper measured effective plasma temperatures from 7,000 to more than 16,000 kelvin as the drive was raised, with electron densities above $10^{21}$ per cubic centimetre, and notes that at the highest drive the neutral argon lines no longer give an accurate measure, so the core may be hotter still. Back in water, Bataller, Kappus, Camara and Putterman probed a micron-sized xenon bubble with 3 nanosecond laser pulses in 2014 and found a plasma density of about 2 × $10^{21}$ per cubic centimetre; in Bataller’s thesis the same bubble’s light fits a blackbody at 9,250 kelvin. Even a snapping shrimp’s claw does it: Lohse, Schmitz and Versluis showed in 2001 that the cavitation bubble a snapping shrimp makes flashes on collapse, which they report as requiring at least 5,000 kelvin inside it.
Hot gas ionises. At those temperatures a fraction of the atoms lose an electron. The 2005 acid spectra were the first strong experimental evidence of that plasma: the emitting species seen could only have been produced by collisions with energetic electrons and ions. The 2014 laser probing is the corresponding evidence in water.
A plasma radiates. Free electrons deflected by ions give off a continuous spectrum called bremsstrahlung, and electrons recombining with ions add to it. The abstract of the 2002 review of the field by Brenner, Hilgenfeldt and Lohse in Reviews of Modern Physics states that the available evidence favours adiabatic heating at collapse, partial ionisation of the gas, and thermal emission such as bremsstrahlung. A 1999 paper by Hilgenfeldt, Grossmann and Lohse in Nature had shown that a simple model with that content, plus “allowance for the small emissivity of a weakly ionized gas,” accounts for the flash intensity, the pulse width, the shape of the spectrum, and the fact that the pulse is the same width at every wavelength. That is the favoured picture. It is not the only one, and I come back to the disagreement below.
Why argon. Dry air is 0.93 percent argon, and it turns out that is the part that glows. Lohse and colleagues proposed in 1997 that at the temperatures of collapse the nitrogen and oxygen in an air bubble react into water-soluble products and dissolve away, so that after many cycles the bubble is essentially pure argon. Ketterling and Apfel confirmed that prediction the next year by mapping where a bubble is stable in water containing argon, nitrogen, or mixtures of the two at set concentrations. This is why air bubbles in water glow so readily, and why the noble gas content of the water is one of the knobs experimenters turn.
The energy budget
This is the part that answers the “water stays cold” observation. Take a flash of a hundred thousand to a million photons at three electron-volts each. That is 5 × $10^{-14}$ to 5 × $10^{-13}$ joules. Spread over 100 picoseconds it is half a milliwatt to five milliwatts at the peak, a respectable little lamp for a tenth of a nanosecond. Repeated 25,000 times a second it averages a thousandth to a hundredth of a microwatt. The hot spot is a micrometre across and gone before the water around it has time to notice. The light cannot warm the flask. What does warm it, slowly, is the transducers and the sound they put into the water, which is a separate path and the reason serious rigs manage the water temperature.
What is remarkable is where the little that does happen is concentrated. Barber and Putterman’s 1991 abstract says eleven orders of magnitude; the Putterman group’s web page today says “the energy of a sound wave in a fluid can concentrate by 12 orders of magnitude.” My cruder count divides the energy density of the sound wave, $p_a^2/2\rho c^2$, about 4 joules per cubic metre at 1.3 atmospheres, among the water molecules in that volume, which gives $10^{-9}$ electron-volts each, and compares that with one 3 electron-volt photon: about ten orders of magnitude. Which number you get depends on what you count as the starting energy, and any of them makes the point. The concentrator is the geometry. A spherical shell of water rushing inward puts the kinetic energy of the whole shell onto a shrinking volume at its centre.
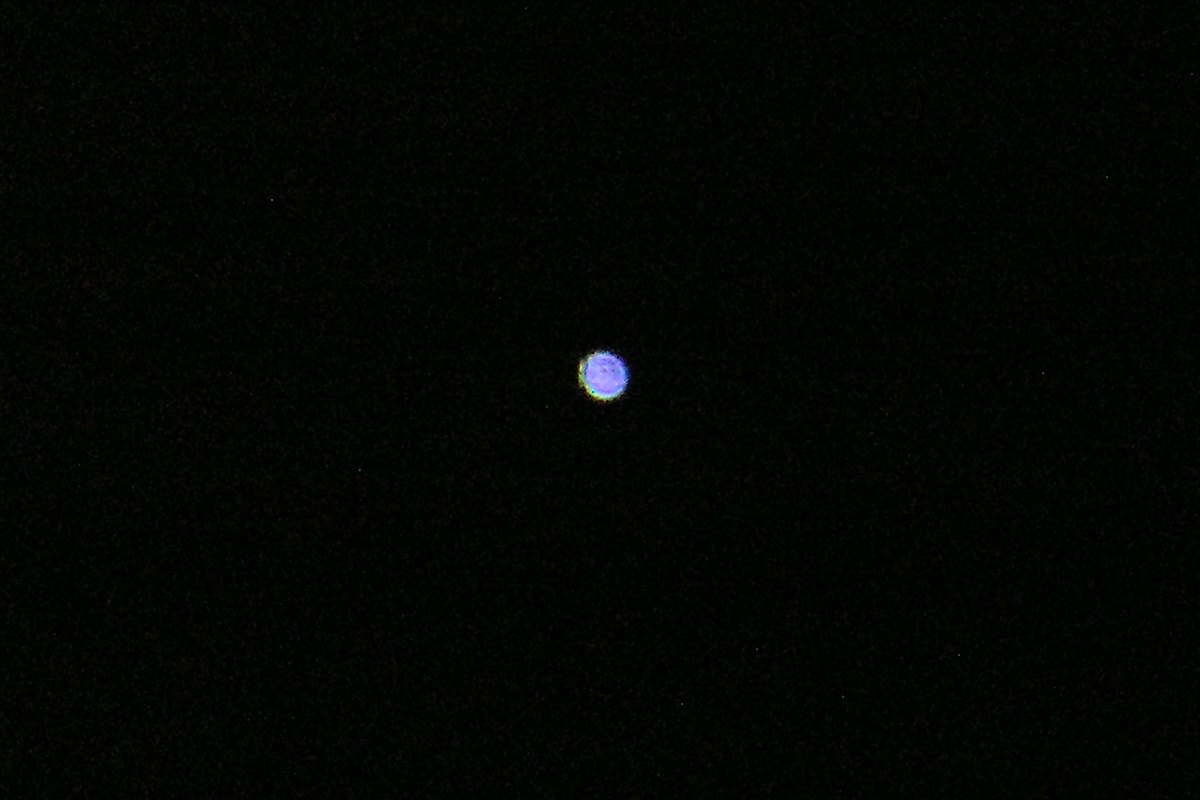 What a camera sees with the room lights off: a glowing bubble at the Institute of Experimental Physics, Košice, ten-second exposure. Photo: Wacker and Ivan Hamráček, via Wikimedia Commons, CC BY-SA 3.0; cropped.
Where the mystery actually sits
The caption said unsolved. Wikipedia’s article, as of the day I read it, says “the mechanism of the phenomenon of sonoluminescence is unknown,” and John Baez’s open-questions page, last revised in 2020, says the exact cause “has been the subject of intense speculation and research.” The 2002 review and the measurements since say the light comes from a hot, partly ionised gas. Those statements are not as far apart as they sound, and it is worth being precise about which parts are which.
What is measured directly, from outside the bubble: the pressure wave, the bubble’s radius against time through most of the collapse, the wall speed, the flash width, the flash timing relative to the minimum radius, the spectrum, and, in sulphuric acid, emission lines that fix a temperature and establish a plasma. Those measurements agree with one another and with the simple picture of an inertial collapse that ends hot.
What is inferred: the state of the interior during the final hundred picoseconds. Nobody has imaged it. What is known of it comes from the light it emits, from laser light scattered or absorbed by it, and from the chemistry it leaves behind. Temperatures fitted to a continuum assume the continuum is thermal, which is exactly the point under dispute, so in water the temperature and the emission mechanism are inferred together. The acid lines and the 2014 laser probing are the measurements that break that circle, and they are the reason the interior is called hot and ionised with confidence.
What is argued, and this is the real open question: what kind of thing the emitting gas is. The Twente picture, the 1999 model that the 2002 review favours, is a weakly ionised gas that is nearly transparent to its own light. The UCLA group has published measurements that cut the other way, and it matters where they were made. Kappus, Khalid, Chakravarty and Putterman reported in 2011 that a xenon bubble, driven at 40 hertz in concentrated phosphoric acid so that it collapses to a radius of tens of micrometres, slower than sound, with a flash lasting hundreds of nanoseconds to a microsecond, passes from transparent to an opaque blackbody at a temperature below 10,000 kelvin and a density below that of the liquid, where an ideal plasma would have a photon scattering length ten thousand times too long to explain the opacity; they propose a phase of matter with the ionisation potential lowered by the density. Khalid, Kappus, Weninger and Putterman followed in 2012, on the same kind of large acid bubble, with a paper whose title states the position: dilute plasma models of sonoluminescence are not valid, the bubbles being up to a thousand times more opaque than the standard ionisation equation allows. The 2014 laser probing brought the same conclusion back to a micron-sized xenon bubble in water, where the transport properties were dominated by strong screening and correlation. The 2002 review also predates the electron densities above $10^{21}$ per cubic centimetre measured in acid in 2010, which are a long way from dilute. That disagreement, thin and weakly ionised against dense and opaque, is live, it is between people who have each spent decades on this, and it is the thing the word “unsolved” is pointing at when it is used carefully. Which emission processes dominate, in what proportions, and from where in the bubble the light is born, all sit inside it.
One more thing sometimes carried under “unsolved,” which is a different kind of question: whether the concentration can be pushed far enough to reach nuclear fusion. A 2002 paper in Science claimed fusion from collapsing bubbles in deuterated acetone. Other groups could not reproduce it, and in 2008 Purdue University found the lead author responsible for research misconduct over the later claims of independent confirmation. That result stays on the shelf, and nothing in the single-bubble parameter range measured above comes close.
So the caption is wrong that how sound becomes a hot spot is a mystery, and right that the physics of the emission is still argued. I would have written the caption differently, and the part it got right is the interesting part.
The replies, taken one at a time
Cavitation. Yes. This is the stable, acoustic kind, one bubble driven for hours, as opposed to the destructive kind that pits propellers and pump impellers.
Energy goes in, photons come out. Yes, and the surprise is the ratio and the mechanism of concentration, which is the spherical collapse described above.
Boat propellers can do it. The same flow cavitation that pits propellers has been shown to glow. Farhat, Chakravarty and Field measured the luminescence from bubbles collapsing in flow over a hydrofoil in a cavitation tunnel, reported in Proceedings of the Royal Society A in 2011, and note that little attention had been paid to the luminescence that accompanies cavitation in pumps, turbines and marine propellers. It is faint. The snapping shrimp does the same with a claw, and its flash is also too dim to see by eye.
The gas glows like a neon sign. Close. A neon sign glows because an electric current excites the gas and its electrons drop back and emit. Here the excitation is thermal, from compression, and in water at full drive the light is a continuum rather than lines. Both are gases glowing because their electrons were given energy; the source of the energy differs.
The water stays cold. See the energy budget. A few milliwatts for a tenth of a nanosecond, twenty-five thousand times a second, in a flask.
What this project makes of it
This site argues that the physics we already have describes the world accurately and often stops short of saying what physically acts. A sonoluminescing bubble is a case where the concentration chain, from sound to a hot spot, can be followed part by part. The medium is water. The wave is a pressure wave. The body that responds is a bubble, which this site has already described from the inside on the Air Bubbles in Water page, and the force that squeezes it and the force that parks it are both pressure gradients in that medium. Every link in that chain has moving parts, and every link is either measured from outside or inferred from the light, and the previous section says which is which. The emission step at the end is borrowed from the plasma physicists, and it is still partly open. By this site’s own rule, agreement with what is measured is the pass condition, and there is nothing in the chain that Pressure-Based Theory adds to or disputes.
What I take from it is narrower and, to me, more useful. First, a pressure gradient in a medium does real work on a body sitting in it, enough to hold a bubble in place against buoyancy and enough to drive it to something like ten thousand kelvin, with no mystery about the agent. Second, spherical convergence is a concentrator, and the same geometry shows up on this site wherever something rounds itself under pressure, from a planet down to a soap film. The bubble is the one case where you can photograph the result.
Where this leaves it
What this project did: it took the caption’s “unsolved mystery” to the primary literature and separated what is measured from what is inferred from what is argued; it re-derived the three numbers a reader is most likely to doubt, the collapse time, the last-stage temperature, and the energy in one flash, from stated inputs, and said plainly which input is an estimate and what it is tested against; and it placed each link of the chain in this site’s own six-part catalog so the status of every claim is visible.
Check, re-runnable by anyone: the script is at /models/sound-in-light-out-v1.py, and
python3 sound-in-light-out-v1.py --selftest
checks Rayleigh’s prefactor by direct integration of his equation from rest, checks the integrator’s wall speed against the closed form, checks the adiabatic step against three closed-form cases and two ordering controls, checks the excluded-volume radius against a hand value, and checks the flash energy against a hand calculation. Those are checks of the arithmetic. They do not validate the minimum radius, which is tested instead against the two published compression ratios above; the script prints that comparison and a sensitivity line. Running it without the flag prints every number used here, including the wrong whole-collapse temperature and why it is wrong.
Exactly how: a few functions of a few lines each, with every input at the top of the file and every input labelled as an assumption. Change the minimum radius and the temperature changes; change the photon count and the power changes.
Compared against the standard: the 2002 Reviews of Modern Physics review is the reference work, and its abstract lays out the same order this article follows, the hydrodynamics, then the gas inside, then the stability conditions, then the emission as the part still under study. Where this article differs is in scope, and in one addition: the review predates the 2005 acid spectra, the 2010 densities, and the 2011 to 2014 opacity measurements, so the table below carries them. The classification uses this site’s catalog rather than the review’s own language, so that it can be compared against every other page here.
| Link | Status here | On what evidence |
|---|---|---|
| Sound is a pressure wave; the bubble grows on tension and collapses on compression, faster than sound in the gas | Proven | Radius against time, Gaitan et al. 1992; pulsed laser scattering through the collapse, Weninger et al. 1997 |
| In sulphuric acid the emitting gas reaches 4,000 to more than 16,000 K | Proven | Atomic and molecular emission lines, Flannigan and Suslick 2005 and 2010 |
| In water the emitting gas reaches 6,000 to 20,000 K depending on the gas, about 9,000 K for xenon | Generally accepted but unproven | Blackbody fits to the continuum, Vazquez et al. 2001 and Bataller’s 2014 thesis, which assume thermal emission |
| The last stage is adiabatic and trapped water vapour caps the temperature | Generally accepted but unproven | Models: Hilgenfeldt et al. 1999; Storey and Szeri 2000; consistent with the measured range |
| The gas partly ionises into a plasma | Proven | Emission lines in sulphuric acid, 2005; electron densities in acid, 2010; laser probing of a xenon bubble in water, 2014 |
| The light is mainly thermal emission from that plasma | Generally accepted but unproven | Favoured by the 2002 review on the strength of the 1999 model’s fit; the interior is not directly observed |
| What the emitting gas is: thin and weakly ionised, or dense and opaque; which processes, from where | Unknown | Hilgenfeldt et al. 1999 (model, water) against Kappus et al. 2011 and Khalid et al. 2012 (xenon in phosphoric acid, 40 Hz) and Bataller et al. 2014 (xenon in water); unresolved |
| Fusion from a collapsing bubble | Unproven | 2002 claim not reproduced; misconduct finding 2008 on the confirmation claims |
Notes on sources, and how firm each claim is
- The post and the replies. My quote post is at x.com/AE4JC/status/2101026359573442768; RobLogic’s original with the video is at x.com/RobLogic/status/2100750509393223728. The clip was downloaded and viewed frame by frame; it shows a flask, a bubble parked at the centre, and a point of light. The replies quoted are paraphrased from the public thread and not attributed by name.
- History. Marinesco and Trillat, C. R. Acad. Sci. 196, 858 (1933) and Frenzel and Schultes, Z. Phys. Chem. B 27, 421 (1934) are described from secondary accounts; I did not read either paper. Gaitan, Crum, Church and Roy, J. Acoust. Soc. Am. 91, 3166 (1992), abstract read in full, which is the source for the 150 kPa, 21 to 25 kHz, glycerine-water, geometric-centre and simultaneous-with-collapse statements.
- Flash counts, widths, and collapse speed. Barber and Putterman, Nature 352, 318 (1991), abstract read in full: “over $10^{5}$ photons,” “too fast to be resolved by the fastest photomultiplier tubes,” “clock-like,” “an amplification of energy by eleven orders of magnitude.” Gompf, Günther, Nick, Pecha and Eisenmenger, Phys. Rev. Lett. 79, 1405 (1997), abstract: 60 to more than 250 picoseconds, nearly Gaussian, identical in the red and ultraviolet. Weninger, Barber and Putterman, Phys. Rev. Lett. 78, 1799 (1997), abstract: faster than Mach 4 relative to the ambient speed of sound of the gas, flash within 500 picoseconds of the minimum radius.
- The mechanism. Brenner, Hilgenfeldt and Lohse, Rev. Mod. Phys. 74, 425 (2002). The abstract was read at the publisher and at the University of Twente repository; the full text was not reachable from here, so what the review favours and how it is organised are taken from its abstract, which states both, and nothing finer than that is claimed. Hilgenfeldt, Grossmann and Lohse, Nature 398, 402 (1999), abstract read in full; the quoted phrase and the list of what the model accounts for are its own words.
- Thermal model, minimum radius, and water vapour. The isothermal-then-adiabatic picture is standard bubble dynamics (Plesset and Prosperetti’s 1977 review; the 1996 and 1997 Twente papers on sonoluminescence phase diagrams); I state it as the standard picture, not from a specific page. Storey and Szeri, Proc. R. Soc. A 456, 1685 (2000), full text read: minimum radius 0.80, 0.70 and 0.65 µm across their three cases for a 4.5 µm argon bubble at 1.2 bar and 26.5 kHz, i.e. 0.14 to 0.18 $R_0$; peak temperature 20,900 K without vapour, 9,700 K with vapour and no chemistry, 7,000 K with vapour and chemistry. Bataller, Exploring the Universality of Sonoluminescence, UCLA thesis (2014), appendix E: a Rayleigh-Plesset fit to continuous Mie scattering, $p_a$ = 1.40 bar, $R_0$ = 3.20 µm, $R_\mathrm{max}$ = 49.4 µm, $R_c$ = 0.547 µm, for a xenon bubble in water; the blackbody fit to its flash, 9,250 K with an emitting radius of 0.47 µm; and the 750 K figure is from Storey and Szeri’s section 4. Storey and Szeri use the Soave-Redlich-Kwong equation of state, so their minimum radius is a model value, as is the Rayleigh-Plesset fit’s; the emitting radius is the check that does not rest on an equation of state. Toegel, Gompf, Pecha and Lohse, Phys. Rev. Lett. 85, 3165 (2000), title only.
- Argon. Lohse, Brenner, Dupont, Hilgenfeldt and Johnston, Phys. Rev. Lett. 78, 1359 (1997), abstract read in full and the arXiv preprint downloaded. Ketterling and Apfel, Phys. Rev. Lett. 81, 4991 (1998), abstract: pure argon, pure nitrogen, and mixtures. The 0.93 percent figure is the standard composition of dry air. The excluded-volume radius is computed in the script from argon’s van der Waals constant, 0.03219 litres per mole, at 1 atm and 293 K; at the bubble’s actual rest pressure, which includes surface tension, it is about 0.60 µm rather than 0.55, which does not change anything above.
- Temperatures and plasma. Vazquez, Camara, Putterman and Weninger, Opt. Lett. 26, 575 (2001), abstract: blackbody temperatures from 6,000 K (H$_2$) to 20,000 K (He) in water. Young, Nelson and Kang, Phys. Rev. Lett. 86, 2673 (2001), abstract: molecular bands at low intensity. Flannigan and Suslick, Nature 434, 52 (2005), abstract via the Zenodo copy: argon, SO and O$_2^+$ emission, 4,000 to 15,000 K, and the statement that single-bubble sonoluminescence “typically produces featureless emission spectra.” Flannigan and Suslick, Nature Physics 6, 598 (2010), abstract via the University of Minnesota experts page: 7,000 to more than 16,000 K, electron density above $10^{21}$ cm$^{-3}$, neutral argon lines no longer accurate at the highest drive. Bataller, Kappus, Camara and Putterman, Phys. Rev. Lett. 113, 024301 (2014), abstract read in full: micron-sized bubble in water, 3 ns laser pulses at 532 and 1064 nm, plasma number density about 2 × $10^{21}$ cm$^{-3}$, transport dominated by strong screening and correlation; the xenon and the 9,250 K are from the thesis above; the APS Physics Focus story on the paper says “around 10,000 kelvin.” Kappus, Khalid, Chakravarty and Putterman, Phys. Rev. Lett. 106, 234302 (2011), abstract read in full; the phosphoric acid, 40 Hz, and tens-of-micrometres description of that experiment is from the 2014 thesis’s own account of it. Khalid, Kappus, Weninger and Putterman, Phys. Rev. Lett. 108, 104302 (2012), abstract read in full, “a 70 µm radius sonoluminescing plasma”; that it is the same 40 Hz phosphoric-acid system rests on the 2014 thesis grouping the two papers together. Lohse, Schmitz and Versluis, Nature 413, 477 (2001), abstract read in full: at least 5,000 K, by reference to an earlier paper. Every water temperature above is a blackbody fit, not a line measurement.
- Propellers and hydrofoils. Farhat, Chakravarty and Field, Proc. R. Soc. A 467, 591 (2011), abstract, including the sentence about pumps, turbines and marine propellers.
- Bubble fusion. Taleyarkhan et al., Science 295, 1868 (2002); the Purdue finding of 18 July 2008 as reported in Nature, Science and Scientific American, which concerned the later claims of independent confirmation. The UCLA group’s page states the result “was not independently reproduced.”
- Wikipedia and Baez. Both quoted from the pages as read on 19 September 2026; the Baez page carries a 2020 revision date. Neither is used as a physics source, only as evidence of how the word “unsolved” is used.
- The re-derived numbers. Rayleigh’s prefactor and the adiabatic relation are textbook. The inputs (50 µm maximum radius, 5 µm rest radius, 1.3 atm acoustic amplitude, $10^{5}$ to $10^{6}$ photons at 3 eV, 100 ps flash, 25.7 kHz) are typical values and are labelled as assumptions in the script. The minimum radius, 0.85 µm, is a sixth of the rest radius, the ratio the two published model estimates above give, with the fitted emitting radius as the independent check; the script prints that comparison, the excluded-volume floor, and a sensitivity line. The eleven and twelve orders of magnitude are Barber and Putterman’s and the UCLA page’s own words; my ten is from the acoustic energy density divided among water molecules, printed by the script.
- Photographs. Three Wikimedia Commons photographs, licences read from the Commons API before download: JWvE (CC BY-SA 4.0, 2016, about 25.7 kHz, four-second exposure), Beazzie (CC BY-SA 4.0, 2019, 27,100 Hz), and Wacker and Ivan Hamráček (CC BY-SA 3.0, 2006, ten-second exposure). Cropped or resized only.
- Review disclosure. Two independent read-only agent passes and six Grok adversarial runs, three on each of the first two drafts, with the worst result governing each round. Every citation’s volume, page and year was confirmed against the publishers’ records by the first agent pass; no fatal error was found by either agent. The first round agreed on four defects, all folded in: the temperature estimate’s minimum radius had been chosen to hit the answer without saying so; the prose called thermal emission settled while the table called it unproven; the acid measurements were being applied to a water bubble without a fence; and water vapour’s established role had been listed as open. The second round confirmed those fixes and found three more, also folded in: the opacity measurements set against the Twente model were made on large xenon bubbles in phosphoric acid at 40 Hz and the fence had not been extended to them; “the measured ceiling near 10,000 K” was contradicted by 20,000 K fits in water that the piece itself now quotes; and the table had credited a water temperature to laser probing that measured density. A third, confirmation round (one agent pass, three Grok runs) found every prior fix holding and two errors the third draft had introduced, both corrected: a 12,350 K figure I had attached to the water bubble was a laser-breakdown plasma in xenon gas from the same thesis, the bubble’s own fit being 9,250 K; and I had written that only the end of the adiabatic stage matters, when the same simulation I cite shows the gas already at 750 K at the start of it.