How Hot Is the Earth's Core, and How Would Anyone Know
14 September 2026
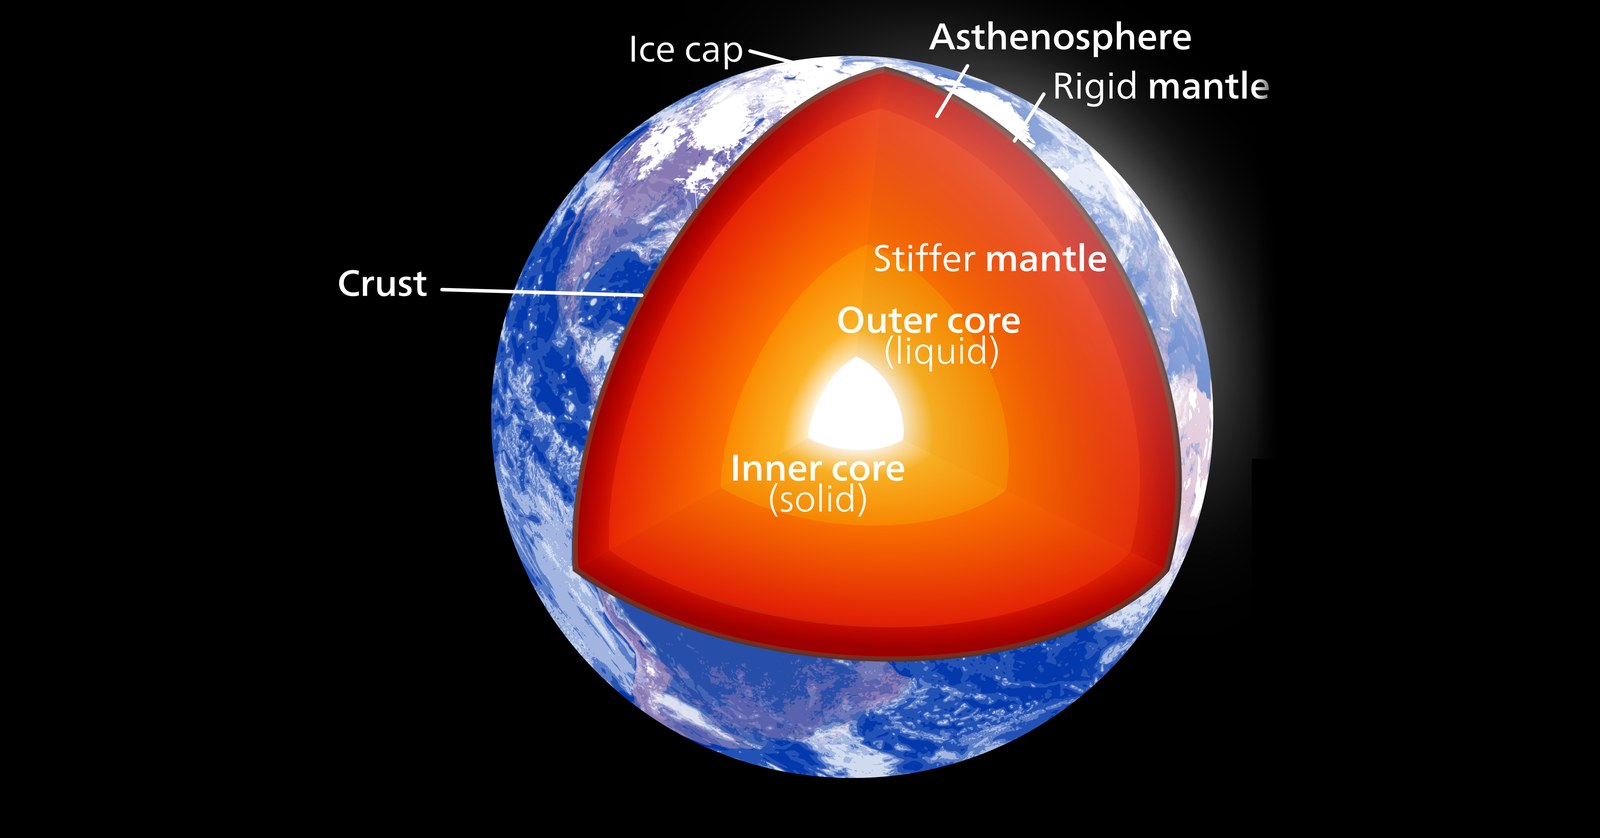 The Earth cut open, drawn to scale: crust, mantle, liquid outer core, solid inner core. Every layer below the crust in this picture is inferred. Illustration: Kelvinsong, via Wikimedia Commons, CC BY-SA 3.0; cropped to the globe and recentred, and shared under the same licence.
I watched a Veritasium clip this week about a three-metre steel sphere full of molten sodium at the University of Maryland, built to model how Earth’s outer core makes a magnetic field. About a minute in, the narrator rules out a permanent magnet as the source. In the words of the auto-generated captions from 1:10: “today we know that the inner core of the earth is solid … the temperature of the inner core is nearly 6,000 Kelvin,” far above the point where iron stops being magnetic. It went by in four seconds.
It was the “today we know” that stopped me. How do we know the makeup and the temperature of the core of the earth?
We don’t. The best we have are inferred estimates. That is not a complaint about the science; the estimates are careful and they are constrained. It is a statement about what kind of thing the number is, and the retelling drops it. Here is what was actually measured, what was inferred from it, and how far apart the estimates sit.
What has been measured
The deepest hole ever drilled is the Kola Superdeep Borehole in northwest Russia, which reached 12,262 metres in 1989 and never went further. Earth’s radius is 6,371 kilometres. The hole reached 0.19 percent of the way down. The boundary between the rocky mantle and the core sits at 2,891 kilometres, and the boundary between the outer core and the inner core at 5,149 kilometres. No instrument has been within 2,800 kilometres of the core and no sample of it exists.
What instruments have recorded is this: the travel times of earthquake waves through the planet, the planet’s mass and its moment of inertia, and the behaviour of iron squeezed and heated in laboratories. Everything said about the core is inferred from those three kinds of record.
What is inferred, link by link
That the outer core is liquid and the inner core is solid. Shear waves cannot travel through a liquid, and they do not cross the outer core. In 1936 Inge Lehmann found compressional waves arriving where the core should have cast a shadow, bent by a boundary inside it. That the material inside that boundary is solid was argued in 1940 and confirmed in 1971 from the slow ringing of the whole Earth after great earthquakes. This is the firmest link in the chain, and it is still an inference from wave arrivals, not an observation of the material.
What the core is made of. Nobody has a sample. The core is taken to be mostly iron because its inferred density matches iron at those pressures, because iron is the abundant heavy element in the meteorites the planet is thought to have formed from, and because a liquid metal is needed to make the magnetic field. The outer core comes out lighter than pure iron would be, by several percent, so it is taken to carry lighter elements. Which ones, and how much of each, is not settled; sulfur, silicon, oxygen, and hydrogen are the usual candidates. The makeup of the core is an inference, and the part of it that matters most for temperature is the part least known.
The pressure at the inner-core boundary. Pressure at depth is the weight of everything above, so it needs the density at every depth. The 1981 reference model fits a density profile to the wave speeds, the free oscillations, the mass, and the moment of inertia, and integrating it gives 135.8 gigapascals at the core-mantle boundary and 328.9 at the inner-core boundary. I re-ran that integration from the model’s published polynomials and got 135.8 and 329.1, with the mass right to better than 0.02 percent; a uniform-density Earth gives 166 at the inner boundary, so the seismic profile is doing real work. The script is here. This link needs no assumption about what the core is made of, and it is the one step in the chain a reader can re-derive from published inputs.
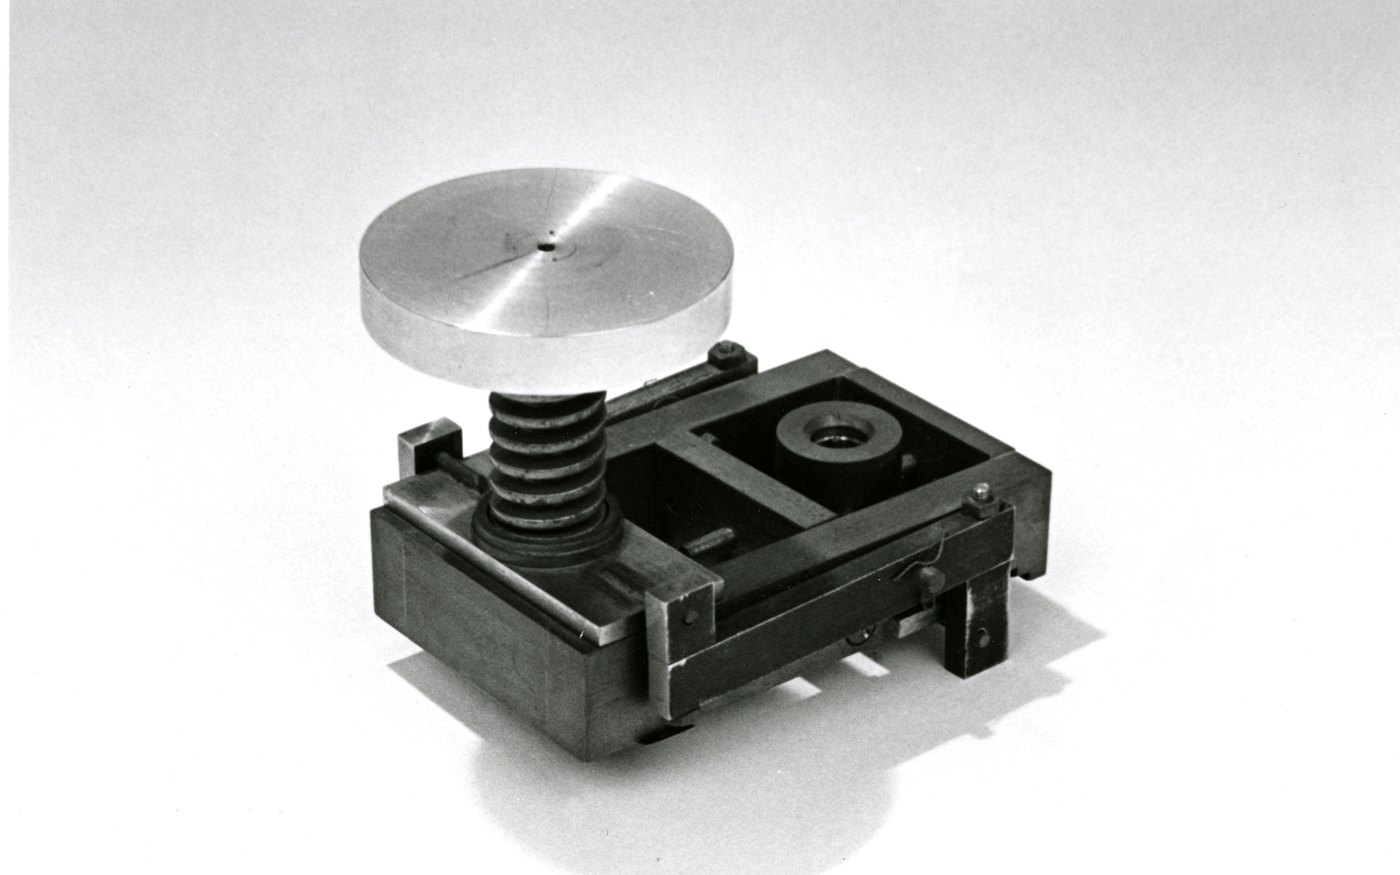 A diamond anvil cell designed at the National Bureau of Standards around 1960. Two gem-cut diamonds squeeze a sample smaller than a grain of sand to pressures found deep inside planets. Its modern descendants are one of the three places the core’s temperature estimate comes from; shock experiments and computation are the others. Photo: National Institute of Standards and Technology, public domain, via Wikimedia Commons; cropped.
The temperature. Where a liquid meets the solid freezing out of it, the boundary sits at the freezing temperature of that material at that pressure. So the inner-core boundary is a freezing surface, and its temperature is the freezing point of the core’s alloy at about 330 gigapascals. Nobody has that alloy, so the laboratories measure pure iron instead: squeeze a speck between two diamonds, heat it with a laser or a resistive element, and watch its X-ray diffraction pattern for the diffuse halo of a liquid; or drive a shock through it and read the temperature as it melts; or compute the melting point from first principles. Every one of those gives a pure-iron number that then has to be corrected, by an unknown amount, for an alloy of unknown recipe.
The estimates
Here is what five influential determinations give for pure iron at the inner-core boundary, in the order they were made.
| Determination | Method | Melting point of pure iron at the boundary |
|---|---|---|
| Boehler, 1993 (Nature) | laser-heated diamond anvil cell to 200 GPa, melting judged by watching the sample surface start to move, extrapolated | 4,850 ± 200 K |
| Alfè, Price and Gillan, 2002 (Physical Review B) | ab initio calculation of the solid and liquid free energies | 6,350 K, ± 300 K statistical only |
| Anzellini and colleagues, 2013 (Science) | laser-heated cell to 200 GPa, melting read by fast X-ray diffraction, extrapolated | 6,230 ± 500 K |
| Sinmyo, Hirose and Ohishi, 2019 (Earth and Planetary Science Letters) | resistance-heated cell to 290 GPa, extrapolated; 5,770 ± 280 K with a different fit form | 5,500 ± 220 K |
| Li and colleagues, 2020 (Geophysical Research Letters) | new shock-temperature measurements to 256 GPa, reduced to 330 GPa | 5,950 ± 400 K |
The 1993 value is treated as superseded; the 2013 authors argue that watching the surface catches recrystallization rather than melting. The rest span 5,500 to 6,350 Kelvin between their central values, an 850 Kelvin disagreement between methods that is larger than any one of their stated error bars. None of the static experiments in the table reached the boundary pressure; each extrapolated the last stretch, and in the 2013 paper that extrapolation is not among the components its error bar lists.
Then the alloy correction, applied by two of the sources themselves. The 2019 authors give 5,120 ± 390 Kelvin as an upper bound for the boundary. The 2013 paper takes a 700 Kelvin depression from the ab initio group’s composition work and, in its supplement, arrives at 4,050 ± 500 Kelvin where the core meets the mantle, which implies about 5,500 at the inner boundary. Two papers, two corrections, 400 Kelvin apart, both resting on a composition nobody has measured.
So the estimate for the inner-core boundary is about 5,100 to 5,500 Kelvin after correction, or 5,500 to 6,350 for the pure iron the experiments actually address. “Nearly 6,000” is the middle of the second range and above the top of the first. Earlier drafts of this piece tried to say where the clip’s figure sat, and got it wrong twice, first as the top of the range and then as the middle, each caught by review. The plain statement is better than either: it is one rounding of one family of estimates, and the retelling gives no way to tell which.
What “known” means here
Every number in this article past twelve kilometres is inferred. The structure is inferred from wave arrivals. The makeup is inferred from density and meteorites. The pressure is inferred from a fitted density profile. The temperature is inferred from pure-iron experiments that stop short of the pressure, corrected for an alloy whose recipe is inferred in turn. The geophysicists who produce these estimates adjust composition, melting, and heat flow together for consistency, and they say so in their papers. The result is a well-constrained estimate with a spread of several hundred Kelvin at the inner boundary and wider at the outer one. What it is not is a measurement, and “today we know” is the wrong verb for it.
What this project makes of it
This site has a good habit, learned in the manufacturing world, of questioning and validating test values, calibrations, methods, sample sizes, reliability, and repeatability. It’s actually kind of surprising how, as a person digs into the scientific world, so many of the values preached as science gospel were “proven” one time, fifty or more years ago, by questionable methods. What the Clocks Were found that for time dilation: four aircraft experiments and nine flights, with the 1971 original quoted as if it were a large body of trials. This case is the better kind. The core’s temperature has been re-examined for thirty years by different methods, and the number moved by nearly 1,400 Kelvin between 1993 and 2013 while the retelling stayed at “we know.” There the gap was between a reading and its interpretation. Here it is between an inference and the word “know.” The inference is good and this project has nothing to add to it. The point is only that a careful chain of estimates should be reported as one, with its spread and its unmeasured inputs named, and that a single figure with “we know” in front of it is not that.
Where this leaves it
What this project did: it went back to the primary determinations and tabulated them with their methods and their own corrections; it re-derived the one step that can be re-derived from published inputs, the pressure at the freezing surface, and published that as a script with a self-test and a negative control; and it cut its own first two attempts to place the popular figure, after review caught each one, in favour of the plain statement above.
Proof, re-runnable by anyone:
python3 how-hot-is-the-core-v1.py --selftest
which reports the transcribed density model reproducing the 1981 paper’s own mass and both boundary pressures to within 0.1 percent, the density on each side of both boundaries to within 0.001 percent, and the uniform-density control failing by 50 percent. Two reviewers tested that self-test by injecting typos into the coefficients. Most passed the first version; the density checks now catch leading-digit errors in the core and lower mantle and nothing above. The real safeguard is that every coefficient was checked line by line against the paper’s table, and the script’s header says so. A self-test that passes is only as good as what it can catch, which is this article’s point applied to itself.
Compared against the documented standard: the Guide to the Expression of Uncertainty in Measurement, the international convention accredited calibration labs work to, asks that an uncertainty statement name its components, say how each was estimated, and combine them. The sources do the first two; each names its components and each error bar is dominated by things estimated by judgement rather than repetition. Nobody combines them across the alloy correction, because that correction is a model input rather than a measurement. So the number the Guide would let you write is a range with named unknowns. That is what this article reports, and it is the difference between an estimate and a measurement.
Notes on sources, and how firm each claim is
- The clip. Veritasium, “Spinning Sphere of Molten Sodium,” YouTube, 14 July 2018; the Facebook repost that reached me is dated 6 April 2025. The quotation is from YouTube’s auto-generated captions between 1:10 and 1:23, so its punctuation is mine and a word may differ from what was spoken. The context, ruling out a permanent magnet because the core is above iron’s Curie point, is as the clip gives it.
- Kola. 12,262 metres in 1989 is the figure the secondary accounts I read give; I did not read a primary Soviet source.
- Boundary depths, pressures, and the density model. Dziewonski and Anderson, Physics of the Earth and Planetary Interiors 25 (1981), the Preliminary Reference Earth Model. The density polynomials in the script were transcribed from that paper’s Table I, checked coefficient by coefficient against the table by an independent reviewer, and verified by reproducing the paper’s mass, both boundary pressures, and the four boundary densities.
- Structure. Lehmann’s 1936 paper is titled P’; the solid inner core was argued by Birch in 1940 and confirmed by Dziewonski and Gilbert in 1971 from free oscillations. Standard historical accounts.
- Makeup. The density deficit and the meteorite argument are textbook; the candidate light elements and the statement that their proportions are unsettled are from the 2013 and 2019 melting papers’ own discussions and from secondary reviews.
- The five melting determinations. Boehler, Nature 363 (1993) 534; Alfè, Price and Gillan, Physical Review B 65 (2002) 165118; Anzellini and colleagues, Science 340 (2013) 464; Sinmyo, Hirose and Ohishi, Earth and Planetary Science Letters 510 (2019) 45; Li and colleagues, Geophysical Research Letters 47 (2020). The 2013 and 2019 full texts were read, the 2013 one by a reviewer and the 2019 one by me: the 2013 paper is the source for its error-budget composition, its recrystallization diagnosis of the 1993 method, and its 700 Kelvin correction, with the 4,050 ± 500 Kelvin figure in its supplement and the 5,500 implied from it; the 2019 paper is the source for 5,500 ± 220 as a 95 percent fit band, 5,770 ± 280 with a Simon-Glatzel fit, the 5,120 ± 390 upper bound, and the description of the 1993 criterion. The 2002 value is quoted in later literature; its ± 300 is the statistical error the group’s 2004 review attaches to it. The 1993 abstract is checked against secondary accounts only.
- The uncertainty standard. JCGM 100:2008, the Guide to the Expression of Uncertainty in Measurement, freely published by the BIPM.
- Review disclosure. Two independent read-only agent passes on earlier drafts (fourteen findings then ten, six fatal in total, all about where the popular figure sat relative to the estimates and about what the self-test could catch), a focused re-check, and this project’s Grok collaboration run adversarially three times with the worst result governing. The author then cut the draft back to the statement it opens with. All findings are folded in.